
Category 4 hurricanes are tropical cyclones that reach Category 4 intensity on the Saffir–Simpson scale. Category 4 hurricanes that later attained Category 5 strength are not included in this list. The Atlantic basin includes the open waters of the Atlantic Ocean, the Caribbean Sea and the Gulf of Mexico. Category 4 is the second-highest hurricane classification category on the Saffir–Simpson Hurricane Scale, and storms that are of this intensity maintain maximum sustained winds of 113–136 knots (130–156 mph, 209–251 km/h). Based on the Atlantic hurricane database, 144 hurricanes have attained Category 4 hurricane status since 1851, the start of modern meteorological record keeping. Category 4 storms are considered extreme hurricanes. Hurricane Ike, which was a Category 4 storm, brought on a 24 feet (7.3 m) storm surge, the third greatest storm surge ever recorded (after Hurricane Katrina and Hurricane Camille, respectively).
Statistics
Wind, Damage, and Storm Surge statistics
Category 4 hurricanes have maximum sustained winds of 113–136 knots (130–156 mph, 209–251 km/h).[1] "Sustained winds" refers to the average wind speed observed over one minute at a height of 10 meters (33 ft) above ground. Gusts can be up to 30% higher than the sustained winds.[2] Mobile homes and other buildings without fixed structures can be completely destroyed, and the lower floors of sturdier structures usually sustain major damage. In addition to the winds, the cyclones generally produce a storm surge of 13–18 feet (4–5.5 m) above normal, potentially causing major beach erosion. Heavy, irreparable damage and/or near complete destruction of gas station canopies and other wide span overhang type structures are also very common, and mobile and manufactured homes are often completely destroyed. Low-level terrain may be flooded well inland, as well.[3] In addition, Category 4 hurricanes are often Cape Verde-type hurricanes. Cape Verde hurricanes are usually the strongest, and their track sometimes points them towards the United States, or other land.[4]
Air pressure statistics
The record high and low statistics for a Category 4 hurricane, in terms of pressure in millibars (mbar) and hectopascals (hPa), are Hurricane Opal of 1995, peaking at a record low of 916 mbar/hPa, and the 1926 Nassau hurricane, peaking at a record high of 967 mbar/hPa. These, on average, are the peaks of a Category 5 major hurricane and a Category 2 hurricane. The average pressure for a Category 4 Atlantic hurricane is between 932 and 945 mbar/hPa, just to delimit boundaries of what pressure a Category 4 hurricane peaks at.
History of Category 4 Atlantic hurricanes
The number of Category 4 and 5 hurricanes appears to have nearly doubled in occurrence from 1970 to 2004.[5] It is likely that the increase in Atlantic tropical storm and hurricane frequency is primarily due to improved monitoring.[6][7][8][9][10]
Due to growing population in major coastal cities, many areas have become more vulnerable to strong hurricanes, especially categories 4 and 5.[11]
Meteorological measurements
All of the storms listed in this analysis are listed in chronological order, but they also list the minimum central pressure and maximum sustained winds. Each of these meteorological readings are taken using a specific meteorological instrument. For modern storms, the minimum pressure measurements are taken by reconnaissance aircraft using dropsondes, or by determining it from satellite imagery using the Dvorak technique. For older storms, pressures are often incomplete, typically being provided by ship-reports or land-observations. None of these methods can provide constant pressure measurements; thus it is possible the only measurement occurred when the cyclone was at a lesser strength.[12] Sustained winds are taken using an Anemometer at 10 meters (33 ft) above the ground.[13]
Climatology
A total of 94 hurricanes in the Atlantic Ocean Basin, including the Gulf of Mexico and the Caribbean, have reached Category 4 status as their peak intensity. (Note that Category 4 storms that intensified later to Category 5 status are not included in this analysis.)
Most Category 4 hurricanes occur during September, with 51 storms occurring in that month. This coincides with the average peak of the Atlantic hurricane season, which occurs on September 10.[14] Most Category 4 hurricanes develop in the warm waters of the Gulf of Mexico and the Caribbean Sea. Several Category 4 hurricanes are Cape Verde-type hurricanes. There have been no Category 4 hurricanes to form in either May or December, or in any other month outside the traditional bounds of the Atlantic hurricane season.
Systems
1851–1949
| Name | Duration | Peak intensity | Areas affected | Damage (USD) |
Deaths | Refs | |
|---|---|---|---|---|---|---|---|
| Wind speed | Pressure | ||||||
| Unnamed | August 30 – September 11, 1853 | 150 mph (240 km/h) | 924 hPa (27.29 inHg) | None | None | None | [15] |
| Unnamed | August 7 – 14, 1856 | 150 mph (240 km/h) | 934 hPa (27.58 inHg) | United States Gulf Coast | [16] | ||
| Unnamed | September 20 – October 7, 1866 | 140 mph (220 km/h) | 938 hPa (27.70 inHg) | The Caribbean | [17] | ||
| Unnamed | September 24 – October 9, 1878 | 140 mph (220 km/h) | 938 hPa (27.70 inHg) | The Caribbean | [18] | ||
| Unnamed | August 4 – 14, 1880 | 150 mph (240 km/h) | 931 hPa (27.49 inHg) | The Caribbean, Mexico, Texas | [19] | ||
| Unnamed | September 27 – October 11, 1880 | 140 mph (220 km/h) | 928 hPa (27.40 inHg) | None | None | None | [20] |
| Unnamed | October 4 - 18, 1882 | 140 mph (220 km/h) | 975 hPa (28.79 inHg) | The Caribbean, Southeastern United States | [21] | ||
| Unnamed | August 12 - 21, 1886 | 150 mph (240 km/h) | 925 hPa (27.32 inHg) | [22] | |||
| Unnamed | September 27 - October 5, 1893 | 130 mph (215 km/h) | 948 hPa (27.99 inHg) | [23] | |||
| Unnamed | October 11 -20, 1894 | 130 mph (215 km/h) | 931 hPa (27.49 inHg) | [24] | |||
| Unnamed | September 25 - October 6, 1898 | 130 mph (215 km/h) | 938 hPa (27.70 inHg) | Eastern United States, Atlantic Canada | [25] | ||
| Unnamed | August 3 - September 4, 1899 | 150 mph (240 km/h) | 930 hPa (27.46 inHg) | The Caribbean, Eastern United States, Atlantic Canada | [26] | ||
| Unnamed | August 27 - September 15, 1900 | 145 mph (230 km/h) | 936 hPa (27.64 inHg) | The Caribbean, Eastern United States, Atlantic Canada | [27] | ||
| Unnamed | August 25 – September 12, 1906 | 130 mph (215 km/h) | 950 hPa (28.05 inHg) | Lesser Antiles, Greater Antiles | [28] | ||
| Unnamed | October 9 – 23, 1910 | 150 mph (240 km/h) | 924 hPa (27.29 inHg) | [29] | |||
| Unnamed | August 5 – 23, 1915 | 145 mph (230 km/h) | 940 hPa (27.76 inHg) | [30] | |||
| Unnamed | September 21 – October 1, 1915 | 145 mph (230 km/h) | 931 hPa (27.49 inHg) | [31] | |||
| Unnamed | August 12 – 20, 1916 | 130 mph (215 km/h) | 932 hPa (27.52 inHg) | [32] | |||
| Unnamed | September 20 – 30, 1917 | 150 mph (240 km/h) | 928 hPa (27.40 inHg) | [33] | |||
| Unnamed | September 2 – 16, 1919 | 150 mph (240 km/h) | 927 hPa (27.37 inHg) | [34] | |||
| Unnamed | October 20 – 30, 1921 | 140 mph (220 km/h) | 941 hPa (27.79 inHg) | [35] | |||
| Unnamed | July 22 - August 2, 1926 | 140 mph (220 km/h) | 967 hPa (28.56 inHg) | ||||
| Unnamed | September 1 – 21, 1926 | 140 mph (220 km/h) | 957 hPa (28.26 inHg) | ||||
| Unnamed | September 11 – 22, 1926 | 150 mph (240 km/h) | 930 hPa (27.46 inHg) | ||||
| Unnamed | October 14 – 28, 1926 | 150 mph (240 km/h) | 934 hPa (27.58 inHg) | ||||
| Unnamed | September 22 – October 4, 1929 | 155 mph (250 km/h) | 924 hPa (27.29 inHg) | The Bahamas, Eastern United States, Atlantic Canada | [36] | ||
| Unnamed | August 29 – September 17, 1930 | 155 mph (250 km/h) | 933 hPa (27.55 inHg) | The Caribbean, Southeastern United States | [37] | ||
| Unnamed | September 1931 | 130 mph (215 km/h) | 952 hPa (28.11 inHg) | ||||
| Unnamed | August 1932 | 150 mph (240 km/h) | 935 hPa (27.61 inHg) | ||||
| Unnamed | September 1932 | 145 mph (230 km/h) | 943 hPa (27.85 inHg) | ||||
| Unnamed | August 1933 | 140 mph (220 km/h) | 940 hPa (27.76 inHg) | ||||
| Unnamed | August, September 1933 | 140 mph (220 km/h) | 945 hPa (27.91 inHg) | ||||
| Unnamed | September 1933 | 140 mph (220 km/h) | 947 hPa (27.96 inHg) | ||||
| Unnamed | August 1935 | 130 mph (215 km/h) | 955 hPa (28.20 inHg) | ||||
| Unnamed | September, October 1935 | 140 mph (220 km/h) | 945 hPa (27.91 inHg) | ||||
| Unnamed | October 1939 | 140 mph (220 km/h) | 941 hPa (27.79 inHg) | ||||
| Unnamed | September 1941 | 130 mph (215 km/h) | 957 hPa (28.26 inHg) | ||||
| Unnamed | August 1943 | 140 mph (220 km/h) | – | ||||
| Unnamed | October 1944 | 145 mph (230 km/h) | 937 hPa (27.67 inHg) | ||||
| Unnamed | September 1945 | 130 mph (215 km/h) | 949 hPa (28.02 inHg) | ||||
| Unnamed | September 1947 | 145 mph (230 km/h) | 938 hPa (27.70 inHg) | ||||
| Unnamed | September 1948 | 130 mph (215 km/h) | 940 hPa (27.76 inHg) | ||||
| Unnamed | September 1948 | 130 mph (215 km/h) | 940 hPa (27.76 inHg) | ||||
| Unnamed | August 1949 | 130 mph (215 km/h) | 954 hPa (28.17 inHg) | ||||
1950–1974

In the years between 1950 and 1974, there were 23 Category 4 hurricanes in the Atlantic Ocean. A dagger (†) denotes that the storm temporarily weakened below Category 4 intensity during the specified period of time.
| Storm name |
Track | Season | Dates as a Category 4 |
Maximum sustained winds |
Minimum pressure | Notes |
|---|---|---|---|---|---|---|
| Hurricane Dog |  |
1950 | September 1–7† | 145 mph (230 km/h) | 943 mbar (hPa; 27.85 inHg) | |
| Hurricane Fox |  |
1950 | September 14–15 | 140 mph (220 km/h) | 946 mbar (hPa; 27.94 inHg) | |
| Hurricane King |  |
1950 | October 18 | 130 mph (215 km/h) | 955 mbar (hPa; 28.2 inHg) | |
| Hurricane Charlie |  |
1951 | August 19 | 130 mph (215 km/h) | 958 mbar (hPa; 28.29 inHg) | |
| Hurricane Easy |  |
1951 | September 7–8 | 150 mph (240 km/h) | 937 mbar (hPa; 27.67 inHg) | |
| Hurricane Fox |  |
1952 | October 15 | 145 mph (230 km/h) | 934 mbar (hPa; 27.58 inHg) | |
| Hurricane Hazel |  |
1954 | October 23–24 | 130 mph (215 km/h) | 938 mbar (hPa; 27.70 inHg) | |
| Hurricane Connie |  |
1955 | August 7 | 140 mph (220 km/h) | 944 mbar (hPa; 27.88 inHg) | |
| Hurricane Ione |  |
1955 | September 18 | 140 mph (220 km/h) | 938 mbar (hPa; 27.70 inHg) | |
| Hurricane Carrie |  |
1957 | September 7–8 | 140 mph (220 km/h) | 945 mbar (hPa; 27.91 inHg) | |
| Hurricane Cleo |  |
1958 | August 16 | 140 mph (220 km/h) | 947 mbar (hPa; 27.96 inHg) | |
| Hurricane Daisy |  |
1958 | August 28 | 130 mph (215 km/h) | 948 mbar (hPa; 27.99 inHg) | |
| Hurricane Helene |  |
1958 | September 27 | 150 mph (240 km/h) | 930 mbar (hPa; 27.46 inHg) | |
| Hurricane Gracie |  |
1959 | September 29 | 140 mph (220 km/h) | 950 mbar (hPa; 28.05 inHg) | |
| Hurricane Donna |  |
1960 | September 6–10† | 145 mph (230 km/h) | 930 mbar (hPa; 27.46 inHg) | |
| Hurricane Betsy |  |
1961 | September 5–6 | 130 mph (215 km/h) | 945 mbar (hPa; 27.91 inHg) | |
| Hurricane Carla |  |
1961 | September 10-11 | 145 mph (233 km/h) | 927 mbar (hPa; 27.73 inHg) | |
| Hurricane Frances |  |
1961 | October 7 | 130 mph (215 km/h) | 948 mbar (hPa; 27.99 inHg) | |
| Hurricane Flora |  |
1963 | October 2–3 | 150 mph (240 km/h) | 933 mbar (hPa; 27.55 inHg) | |
| Hurricane Cleo |  |
1964 | August 23–24 | 150 mph (240 km/h) | 938 mbar (hPa; 27.70 inHg) | |
| Hurricane Dora |  |
1964 | September 6 | 130 mph (215 km/h) | 942 mbar (hPa; 27.82 inHg) | |
| Hurricane Gladys |  |
1964 | September 17 | 130 mph (215 km/h) | 945 mbar (hPa; 27.91 inHg) | |
| Hurricane Hilda |  |
1964 | October 1–2 | 140 mph (220 km/h) | 941 mbar (hPa; 27.79 inHg) | |
| Hurricane Betsy |  |
1965 | September 4–9† | 140 mph (220 km/h) | 942 mbar (hPa; 27.82 inHg) | |
| Hurricane Celia |  |
1970 | August 3 | 140 mph (220 km/h) | 944 mbar (hPa; 27.88 inHg) | |
| Hurricane Carmen |  |
1974 | September 1–7† | 150 mph (240 km/h) | 928 mbar (hPa; 27.40 inHg) | |
| Sources: Atlantic Hurricane Best Track File 1851–2012[38] | ||||||
1975–1999

In the years between 1976 and 1999, 23 Category 4 hurricanes formed in the basin:
| Storm name |
Track | Season | Dates as a Category 4 |
Maximum sustained winds |
Minimum pressure | Notes |
|---|---|---|---|---|---|---|
| Hurricane Gladys |  |
1975 | October 2–3 | 140 mph (220 km/h) | 939 mbar (hPa; 27.73 inHg) | |
| Hurricane Ella |  |
1978 | September 4 | 140 mph (220 km/h) | 956 mbar (hPa; 28.23 inHg) | |
| Hurricane Greta |  |
1978 | September 18 | 130 mph (215 km/h) | 947 mbar (hPa; 27.96 inHg) | |
| Hurricane Frederic |  |
1979 | September 12–13 | 130 mph (215 km/h) | 943 mbar (hPa; 27.85 inHg) | |
| Hurricane Harvey |  |
1981 | September 14 | 130 mph (215 km/h) | 946 mbar (hPa; 27.94 inHg) | |
| Hurricane Debby |  |
1982 | September 18 | 130 mph (215 km/h) | 950 mbar (hPa; 28.05 inHg) | |
| Hurricane Diana |  |
1984 | September 11-12 | 130 mph (215 km/h) | 949 mbar (hPa; 28.02 inHg) | |
| Hurricane Gloria |  |
1985 | September 24-25 | 145 mph (230 km/h) | 919 mbar (hPa; 27.14 inHg) | |
| Hurricane Helene |  |
1988 | September 22-23 | 145 mph (230 km/h) | 938 mbar (hPa; 27.70 inHg) | |
| Hurricane Joan |  |
1988 | October 21-22 | 145 mph (230 km/h) | 932 mbar (hPa; 27.52 inHg) | |
| Hurricane Gabrielle |  |
1989 | September 4–7 | 145 mph (230 km/h) | 937 mbar (hPa; 27.67 inHg) | |
| Hurricane Claudette |  |
1991 | September 7 | 130 mph (215 km/h) | 944 mbar (hPa; 27.88 inHg) | |
| Hurricane Felix |  |
1995 | August 12-13 | 140 mph (220 km/h) | 929 mbar (hPa; 27.43 inHg) | |
| Hurricane Luis |  |
1995 | September 1-8 | 150 mph (240 km/h) | 935 mbar (hPa; 27.61 inHg) | |
| Hurricane Opal | 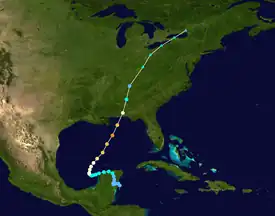 |
1995 | October 4 | 150 mph (240 km/h) | 916 mbar (hPa; 27.05 inHg) | |
| Hurricane Edouard |  |
1996 | August 25-28† | 145 mph (230 km/h) | 933 mbar (hPa; 27.55 inHg) | |
| Hurricane Hortense |  |
1996 | September 12–13 | 140 mph (220 km/h) | 935 mbar (hPa; 27.61 inHg) | |
| Hurricane Georges |  |
1998 | September 19-20 | 155 mph (250 km/h) | 937 mbar (hPa; 27.67 inHg) | |
| Hurricane Bret |  |
1999 | August 22 | 145 mph (230 km/h) | 944 mbar (hPa; 27.88 inHg) | |
| Hurricane Cindy |  |
1999 | August 28-29 | 140 mph (220 km/h) | 942 mbar (hPa; 27.81 inHg) | |
| Hurricane Floyd |  |
1999 | September 12-14† | 155 mph (250 km/h) | 921 mbar (hPa; 27.2 inHg) | |
| Hurricane Gert |  |
1999 | September 15–17† | 150 mph (240 km/h) | 930 mbar (hPa; 27.46 inHg) | |
| Hurricane Lenny |  |
1999 | November 17-18 | 155 mph (250 km/h) | 933 mbar (hPa; 27.55 inHg) | |
Sources: Atlantic Hurricane Best Track File 1851–2012[38] | ||||||
2000–present
In the years since 2000, 36 Category 4 hurricanes formed within the confines of the Atlantic Ocean. A dagger (†) denotes that the storm temporarily weakened below Category 4 intensity during the specified period of time.
| Storm name |
Track | Season | Dates as a Category 4 |
Maximum sustained winds |
Minimum pressure | Notes |
|---|---|---|---|---|---|---|
| Hurricane Isaac |  |
2000 | September 28-29 | 140 mph (220 km/h) | 943 mbar (hPa; 27.85 inHg) | |
| Hurricane Keith |  |
2000 | October 1 | 140 mph (220 km/h) | 939 mbar (hPa; 27.73 inHg) | |
| Hurricane Iris |  |
2001 | October 8–9 | 145 mph (230 km/h) | 948 mbar (hPa; 27.99 inHg) | |
| Hurricane Michelle |  |
2001 | November 3–4† | 140 mph (220 km/h) | 933 mbar (hPa; 27.55 inHg) | |
| Hurricane Lili |  |
2002 | October 2–3 | 145 mph (230 km/h) | 938 mbar (hPa; 27.70 inHg) | |
| Hurricane Fabian |  |
2003 | August 31–September 5† | 145 mph (230 km/h) | 939 mbar (hPa; 27.73 inHg) | |
| Hurricane Charley |  |
2004 | August 13 | 150 mph (240 km/h) | 941 mbar (hPa; 27.79 inHg) | |
| Hurricane Frances |  |
2004 | August 28–September 2† | 145 mph (230 km/h) | 935 mbar (hPa; 27.61 inHg) | |
| Hurricane Karl |  |
2004 | September 20–21† | 145 mph (230 km/h) | 938 mbar (hPa; 27.70 inHg) | |
| Hurricane Dennis |  |
2005 | July 8–10† | 150 mph (240 km/h) | 930 mbar (hPa; 27.46 inHg) | |
| Hurricane Gustav |  |
2008 | August 30–31 | 155 mph (250 km/h) | 941 mbar (hPa; 27.79 inHg) | |
| Hurricane Ike |  |
2008 | September 4–8† | 145 mph (230 km/h) | 935 mbar (hPa; 27.61 inHg) | |
| Hurricane Omar |  |
2008 | October 16 | 130 mph (215 km/h) | 958 mbar (hPa; 28.29 inHg) | |
| Hurricane Paloma |  |
2008 | November 8 | 145 mph (230 km/h) | 944 mbar (hPa; 27.88 inHg) | |
| Hurricane Bill |  |
2009 | August 19–20 | 130 mph (215 km/h) | 943 mbar (hPa; 27.85 inHg) | |
| Hurricane Danielle |  |
2010 | August 27 | 130 mph (215 km/h) | 942 mbar (hPa; 27.82 inHg) | |
| Hurricane Earl |  |
2010 | August 30–September 2† | 145 mph (230 km/h) | 927 mbar (hPa; 27.37 inHg) | |
| Hurricane Igor |  |
2010 | September 12–17 | 155 mph (250 km/h) | 924 mbar (hPa; 27.29 inHg) | |
| Hurricane Julia |  |
2010 | September 15 | 140 mph (220 km/h) | 948 mbar (hPa; 27.99 inHg) | |
| Hurricane Katia |  |
2011 | September 6 | 140 mph (220 km/h) | 942 mbar (hPa; 27.82 inHg) | |
| Hurricane Ophelia |  |
2011 | October 2 | 140 mph (220 km/h) | 940 mbar (hPa; 27.76 inHg) | |
| Hurricane Gonzalo |  |
2014 | October 15–17† | 145 mph (230 km/h) | 940 mbar (hPa; 27.76 inHg) | |
| Hurricane Joaquin |  |
2015 | October 1–3† | 155 mph (250 km/h) | 931 mbar (hPa; 27.64 inHg) | |
| Hurricane Nicole |  |
2016 | October 12–13 | 140 mph (220 km/h) | 950 mbar (hPa; 28.05 inHg) | |
| Hurricane Harvey |  |
2017 | August 26 | 130 mph (215 km/h) | 937 mbar (hPa; 27.67 inHg) | |
| Hurricane Jose |  |
2017 | September 8–10 | 155 mph (250 km/h) | 938 mbar (hPa; 27.70 inHg) | |
| Hurricane Florence |  |
2018 | September 5–12† | 150 mph (240 km/h) | 937 mbar (hPa; 27.67 inHg) | |
| Hurricane Laura |  |
2020 | August 26–27 | 150 mph (240 km/h) | 937 mbar (hPa; 27.67 inHg) | |
| Hurricane Teddy |  |
2020 | September 17–18 | 140 mph (220 km/h) | 945 mbar (hPa; 27.91 inHg) | |
| Hurricane Delta |  |
2020 | October 6 | 140 mph (220 km/h) | 953 mbar (hPa; 28.14 inHg) | |
| Hurricane Eta |  |
2020 | November 2–3 | 150 mph (240 km/h) | 923 mbar (hPa; 27.26 inHg) | |
| Hurricane Iota |  |
2020 | November 16–17 | 155 mph (250 km/h) | 917 mbar (hPa; 27.08 inHg) | |
| Hurricane Ida |  |
2021 | August 29 | 150 mph (240 km/h) | 929 mbar (hPa; 27.43 inHg) | |
| Hurricane Sam |  |
2021 | September 25–October 2† | 155 mph (250 km/h) | 927 mbar (hPa; 27.4 inHg) | |
| Hurricane Fiona |  |
2022 | September 21–23 | 140 mph (220 km/h) | 931 mbar (hPa; 27.34 inHg) | |
| Hurricane Franklin |  |
2023 | August 28–29 | 150 mph (240 km/h) | 926 mbar (hPa; 27.67 inHg) | |
| Hurricane Idalia |  |
2023 | August 30 | 130 mph (215 km/h) | 940 mbar (hPa; 27.76 inHg) | |
Sources: Atlantic Hurricane Best Track File 1851–2012[38] | ||||||
Number by month
| Month | Number of hurricanes |
|---|---|
| July | 2 |
| August | 40 |
| September | 53 |
| October | 47 |
| November | 5 |
Landfalls
The following hurricanes from the above lists made landfall at some location while a tropical cyclone with winds of greater than 39 mph (63 km/h). Due to inaccuracies in data, tropical depression landfalls are not included. Category 5 hurricanes are also not included in the table below. Several of these storms weakened slightly after attaining Category 4 status as they approached land; this is usually a result of dry air, shallower water due to shelving, cooler waters, or interaction with land.
See also
References
- ↑ National Hurricane Center (2007). "Saffir-Simpson Scale". National Weather Service. Retrieved 2007-11-09.
- ↑ Landsea, Chris (2006). "FAQ subject D4". HURDAT. Retrieved 2007-12-17.
- ↑ National Hurricane Center (June 22, 2006). "Saffir-Simpson Hurricane Scale Information". National Oceanic and Atmospheric Administration. Retrieved 2007-11-13.
- ↑ Landsea, Chris (2006). "FAQ subject A2". HURDAT. Retrieved 2007-12-17.
- ↑ NSF (2005). "severe Hurricanes doubled in the past 35 years". NSF. Retrieved 2013-09-03.
- ↑ Vecchi, Gabriel. "Historical Changes in Atlantic Hurricane and Tropical Storms". gfdl.noaa. Retrieved 2018-09-14.
- ↑ Villarini, Gabriele; Vecchi, Gabriel (2011). "Is the recorded increase in short‐duration North Atlantic tropical storms spurious?". Journal of Geophysical Research. 116 (D10). Bibcode:2011JGRD..11610114V. doi:10.1029/2010JD015493. S2CID 3372885.
- ↑ Vecchi, Gabriel; Knutson, Thomas (2011). "Estimating Annual Numbers of Atlantic Hurricanes Missing from the HURDAT Database (1878–1965) Using Ship Track Density". Journal of Climate. 24 (6): 1736–1746. Bibcode:2011JCli...24.1736V. doi:10.1175/2010JCLI3810.1. S2CID 16450561.
- ↑ Landsea, Christopher; Vecchi, Gabriel (2010). "Impact of Duration Thresholds on Atlantic Tropical Cyclone Counts". Journal of Climate. 23 (10): 2508–2519. Bibcode:2010JCli...23.2508L. CiteSeerX 10.1.1.163.4825. doi:10.1175/2009JCLI3034.1. S2CID 3343986.
- ↑ Vecchi, Gabriel; Knutson, Thomas (2008). "On Estimates of Historical North Atlantic Tropical Cyclone Activity". Journal of Climate. 21 (14): 3580–3600. Bibcode:2008JCli...21.3580V. doi:10.1175/2008JCLI2178.1. S2CID 14752199.
- ↑ weather.com - Vulnerable Cities: Index Archived 2007-12-22 at the Wayback Machine
- ↑ Hock, Terry (2007). "GPS dropsondes". NCAR. Archived from the original on June 7, 2007. Retrieved 2007-12-16.
- ↑ Federal Emergency Management Agency (2004). "Hurricane Glossary of Terms". Archived from the original on 2005-12-14. Retrieved 2006-03-24. Accessed through the Wayback Machine.
- ↑ National Hurricane Center (2007-03-08). "Tropical Cyclone Climatology". National Oceanic and Atmospheric Administration. Archived from the original on 2007-12-13. Retrieved 2007-11-13.
- ↑ "1853 Major Hurricane Not Named (1853242N12336)". International Best Track Archive for Climate Stewardship. Retrieved June 13, 2022.
- ↑ "1856 Major Hurricane Not Named (1856221N25277)". International Best Track Archive for Climate Stewardship. Retrieved June 13, 2022.
- ↑ "1866 Major Hurricane Not Named (1866264N11342)". International Best Track Archive for Climate Stewardship. Retrieved June 13, 2022.
- ↑ "1878 Major Hurricane Not Named (1878267N15288)". International Best Track Archive for Climate Stewardship. Retrieved June 13, 2022.
- ↑ "1880 Major Hurricane Not Named (1880217N16300)". International Best Track Archive for Climate Stewardship. Retrieved June 13, 2022.
- ↑ "1880 Major Hurricane Not Named (1880271N23317)". International Best Track Archive for Climate Stewardship. Retrieved June 13, 2022.
- ↑ "1882 Major Hurricane Not Named (1882278N11279)". International Best Track Archive for Climate Stewardship. Retrieved June 13, 2022.
- ↑ "1886 Major Hurricane Not Named (1886224N11303)". International Best Track Archive for Climate Stewardship. Retrieved June 13, 2022.
- ↑ "1893 Major Hurricane Not Named (1893271N16278)". International Best Track Archive for Climate Stewardship. Retrieved June 13, 2022.
- ↑ "1894 Major Hurricane Not Named (1894284N11303)". International Best Track Archive for Climate Stewardship. Retrieved June 13, 2022.
- ↑ "1898 Major Hurricane Not Named (1898268N16302)". International Best Track Archive for Climate Stewardship. Retrieved June 13, 2022.
- ↑ "1899 Major Hurricane Not Named (1899215N12329)". International Best Track Archive for Climate Stewardship. Retrieved June 13, 2022.
- ↑ "1900 Major Hurricane Not Named (1900239N15318)". International Best Track Archive for Climate Stewardship. Retrieved June 13, 2022.
- ↑ "1906 Major Hurricane Not Named (1906238N14339)". International Best Track Archive for Climate Stewardship. Retrieved June 13, 2022.
- ↑ "1910 Major Hurricane Not Named (1910282N11281)". International Best Track Archive for Climate Stewardship. Retrieved June 13, 2022.
- ↑ "1915 Major Hurricane Not Named (1915218N14334)". International Best Track Archive for Climate Stewardship. Retrieved June 13, 2022.
- ↑ "1915 Major Hurricane Not Named (1915218N14334)". International Best Track Archive for Climate Stewardship. Retrieved June 13, 2022.
- ↑ "1916 Major Hurricane Not Named (1916225N13305)". International Best Track Archive for Climate Stewardship. Retrieved June 13, 2022.
- ↑ "1917 Major Hurricane Not Named (1917263N13303)". International Best Track Archive for Climate Stewardship. Retrieved June 13, 2022.
- ↑ "1919 Major Hurricane Not Named (1919246N16299)". International Best Track Archive for Climate Stewardship. Retrieved June 13, 2022.
- ↑ "1921 Major Hurricane Not Named (1921293N13280)". International Best Track Archive for Climate Stewardship. Retrieved June 13, 2022.
- ↑ "1929 Major Hurricane Not Named (1929262N23296)". International Best Track Archive for Climate Stewardship. Retrieved October 16, 2022.
- ↑ "1930 Major Hurricane Not Named (1930241N13317)". International Best Track Archive for Climate Stewardship. Retrieved October 16, 2022.
- 1 2 3 "Atlantic hurricane best track (HURDAT version 2)" (Database). United States National Hurricane Center. April 19, 2022.
- ↑ "Atlantic hurricane best track (HURDAT version 2)" (Database). United States National Hurricane Center. April 5, 2023. Retrieved January 14, 2024.
 This article incorporates text from this source, which is in the public domain.
| |||||||||||||||||||||||||
| |||||||||||||||||||||||||
| |||||||||||||||||||||||||