Weisen | |
|---|---|
Location of Weisen within Prignitz district 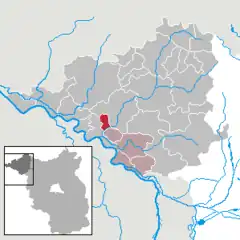 | |
 Weisen  Weisen | |
| Coordinates: 53°02′N 11°47′E / 53.033°N 11.783°E | |
| Country | Germany |
| State | Brandenburg |
| District | Prignitz |
| Municipal assoc. | Bad Wilsnack/Weisen |
| Government | |
| • Mayor (2019–24) | David Leu[1] |
| Area | |
| • Total | 15.60 km2 (6.02 sq mi) |
| Elevation | 22 m (72 ft) |
| Population (2021-12-31)[2] | |
| • Total | 976 |
| • Density | 63/km2 (160/sq mi) |
| Time zone | UTC+01:00 (CET) |
| • Summer (DST) | UTC+02:00 (CEST) |
| Postal codes | 19322 |
| Dialling codes | 03877 |
| Vehicle registration | PR |
Weisen is a municipality in the Prignitz district, in Brandenburg, Germany. It consists of the main village Weisen, the small settlement Waldhaus and the village Schilde.
Geography
Weisen is located between the towns of Wittenberge in the southwest and Perleberg in the northeast, from which Weisen is separated by a forest. The south border of Weisen is marked by the Stepenitz river with the municipality of Breese on the other side. The west border corresponds roughly to the Berlin–Hamburg Railway. The village of Schilde constitutes the northern part of the municipality of Weisen. North of Schilde is Dergenthin, which belongs to Perleberg.
The German federal highway 189 crosses between the villages Weisen and Schilde. The village of Weisen has a train stop on the Wittenberge–Wittstock–Berlin railway.
Weisen is situated in the Elbe Urstromtal. Parts of the municipality belong to the UNESCO biosphere reserve Elbe river landscape.
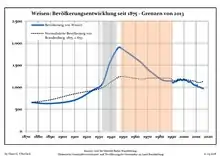
Demography
|
|
References
- ↑ Landkreis Prignitz Wahl der Bürgermeisterin / des Bürgermeisters, accessed 2 July 2021.
- ↑ "Bevölkerungsentwicklung und Flächen der kreisfreien Städte, Landkreise und Gemeinden im Land Brandenburg 2021" (PDF). Amt für Statistik Berlin-Brandenburg (in German). June 2022.
- ↑ Detailed data sources are to be found in the Wikimedia Commons.Population Projection Brandenburg at Wikimedia Commons
Towns and municipalities in Prignitz | ||
|---|---|---|
Coat of Arms of Prignitz district | ||