| Tønder | |
|---|---|
| Tønder | |
| Nomination district constituency for the Folketing | |
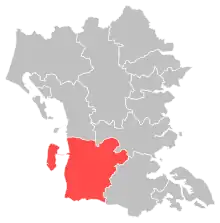 Location of Tønder within South Jutland | |
 Location of South Jutland within Denmark | |
| Municipalities | Tønder |
| Constituency | South Jutland |
| Electorate | 26,559 (2022) [1] |
| Current constituency | |
| Created | 1920[2] |
Tønder nominating district is one of the 92 nominating districts that exists for Danish elections following the 2007 municipal reform.[3][4][5] It consists of Tønder Municipality.[6] It was created in 1920[7] following its reunification with Denmark, though its boundaries have been changed since then.
In general elections, the district is a very strong area for parties commonly associated with the blue bloc.[8]
General elections results
General elections in the 2020s
| Parties | Vote | |||||
|---|---|---|---|---|---|---|
| Votes | % | + / - | ||||
| Social Democrats | 5,601 | 26.21 | +1.72 | |||
| Venstre | 3,277 | 15.33 | -17.78 | |||
| Denmark Democrats | 3,190 | 14.93 | New | |||
| Moderates | 2,701 | 12.64 | New | |||
| New Right | 1,681 | 7.87 | +3.35 | |||
| Liberal Alliance | 1,194 | 5.59 | +3.89 | |||
| Green Left | 1,074 | 5.03 | -0.40 | |||
| Conservatives | 983 | 4.60 | +0.20 | |||
| Danish People's Party | 641 | 3.00 | -10.07 | |||
| Red–Green Alliance | 335 | 1.57 | -1.44 | |||
| Social Liberals | 277 | 1.30 | -2.31 | |||
| Christian Democrats | 192 | 0.90 | -2.06 | |||
| The Alternative | 178 | 0.83 | -0.28 | |||
| Independent Greens | 26 | 0.12 | New | |||
| Kent Nielsen | 20 | 0.09 | New | |||
| Kenneth Vestergaard | 2 | 0.01 | New | |||
| Total | 21,372 | |||||
| Source[9] | ||||||
General elections in the 2010s
| Parties | Vote | |||||
|---|---|---|---|---|---|---|
| Votes | % | + / - | ||||
| Venstre | 7,318 | 33.11 | +6.43 | |||
| Social Democrats | 5,413 | 24.49 | +3.20 | |||
| Danish People's Party | 2,889 | 13.07 | -16.34 | |||
| Green Left | 1,201 | 5.43 | +3.06 | |||
| New Right | 999 | 4.52 | New | |||
| Conservatives | 972 | 4.40 | +2.38 | |||
| Social Liberals | 799 | 3.61 | +1.01 | |||
| Red–Green Alliance | 666 | 3.01 | -1.58 | |||
| Christian Democrats | 654 | 2.96 | +1.28 | |||
| Stram Kurs | 424 | 1.92 | New | |||
| Liberal Alliance | 376 | 1.70 | -5.60 | |||
| The Alternative | 245 | 1.11 | -0.95 | |||
| Klaus Riskær Pedersen Party | 138 | 0.62 | New | |||
| Michael Thomsen | 11 | 0.05 | New | |||
| Total | 22,105 | |||||
| Source[10] | ||||||
| Parties | Vote | |||||
|---|---|---|---|---|---|---|
| Votes | % | + / - | ||||
| Danish People's Party | 6,958 | 29.41 | +15.64 | |||
| Venstre | 6,313 | 26.68 | -9.83 | |||
| Social Democrats | 5,038 | 21.29 | -3.06 | |||
| Liberal Alliance | 1,727 | 7.30 | +2.56 | |||
| Red–Green Alliance | 1,087 | 4.59 | +1.70 | |||
| Social Liberals | 614 | 2.60 | -2.76 | |||
| Green Left | 560 | 2.37 | -4.53 | |||
| The Alternative | 488 | 2.06 | New | |||
| Conservatives | 478 | 2.02 | -1.60 | |||
| Christian Democrats | 397 | 1.68 | -0.14 | |||
| Total | 23,660 | |||||
| Source[11] | ||||||
| Parties | Vote | |||||
|---|---|---|---|---|---|---|
| Votes | % | + / - | ||||
| Venstre | 8,948 | 36.51 | -2.89 | |||
| Social Democrats | 5,967 | 24.35 | +2.32 | |||
| Danish People's Party | 3,374 | 13.77 | -1.61 | |||
| Green Left | 1,691 | 6.90 | -1.99 | |||
| Social Liberals | 1,313 | 5.36 | +2.38 | |||
| Liberal Alliance | 1,162 | 4.74 | +3.17 | |||
| Conservatives | 887 | 3.62 | -4.12 | |||
| Red–Green Alliance | 708 | 2.89 | +2.22 | |||
| Christian Democrats | 446 | 1.82 | +0.48 | |||
| Niesl-Aage Bjerre | 6 | 0.02 | New | |||
| Jørn Bjorholm | 4 | 0.02 | New | |||
| Total | 24,506 | |||||
| Source[12] | ||||||
General elections in the 2000s
| Parties | Vote | |||||
|---|---|---|---|---|---|---|
| Votes | % | + / - | ||||
| Venstre | 9,733 | 39.40 | -1.00 | |||
| Social Democrats | 5,443 | 22.03 | -1.94 | |||
| Danish People's Party | 3,799 | 15.38 | +1.94 | |||
| Green Left | 2,196 | 8.89 | +5.18 | |||
| Conservatives | 1,913 | 7.74 | +0.20 | |||
| Social Liberals | 736 | 2.98 | -2.68 | |||
| New Alliance | 388 | 1.57 | New | |||
| Christian Democrats | 332 | 1.34 | -0.72 | |||
| Red–Green Alliance | 166 | 0.67 | -1.15 | |||
| Total | 24,706 | |||||
| Source[13] | ||||||
| Parties | Vote | |||||
|---|---|---|---|---|---|---|
| Votes | % | + / - | ||||
| Venstre | 6,321 | 40.40 | -1.51 | |||
| Social Democrats | 3,750 | 23.97 | -2.64 | |||
| Danish People's Party | 2,103 | 13.44 | +2.23 | |||
| Conservatives | 1,180 | 7.54 | -0.09 | |||
| Social Liberals | 886 | 5.66 | +2.53 | |||
| Green Left | 581 | 3.71 | -0.09 | |||
| Christian Democrats | 322 | 2.06 | -0.12 | |||
| Red–Green Alliance | 285 | 1.82 | +0.64 | |||
| Centre Democrats | 175 | 1.12 | -0.24 | |||
| Minority Party | 42 | 0.27 | New | |||
| Total | 15,645 | |||||
| Source[14] | ||||||
| Parties | Vote | |||||
|---|---|---|---|---|---|---|
| Votes | % | + / - | ||||
| Venstre | 6,973 | 41.91 | +7.51 | |||
| Social Democrats | 4,428 | 26.61 | -6.26 | |||
| Danish People's Party | 1,865 | 11.21 | +10.46 | |||
| Conservatives | 1,269 | 7.63 | +1.23 | |||
| Green Left | 633 | 3.80 | -0.45 | |||
| Social Liberals | 520 | 3.13 | +0.32 | |||
| Christian People's Party | 363 | 2.18 | -0.79 | |||
| Centre Democrats | 227 | 1.36 | -2.49 | |||
| Red–Green Alliance | 196 | 1.18 | -0.15 | |||
| Progress Party | 164 | 0.99 | -1.76 | |||
| Total | 16,638 | |||||
| Source[15] | ||||||
General elections in the 1990s
| Parties | Vote | |||||
|---|---|---|---|---|---|---|
| Votes | % | + / - | ||||
| Venstre | 5,750 | 34.40 | +1.07 | |||
| Social Democrats | 5,494 | 32.87 | -0.25 | |||
| Democratic Renewal | 1,265 | 7.57 | New | |||
| Conservatives | 1,070 | 6.40 | -6.56 | |||
| Green Left | 711 | 4.25 | +0.66 | |||
| Centre Democrats | 643 | 3.85 | +1.97 | |||
| Christian People's Party | 497 | 2.97 | +0.59 | |||
| Social Liberals | 470 | 2.81 | -0.40 | |||
| Progress Party | 459 | 2.75 | -4.96 | |||
| Red–Green Alliance | 222 | 1.33 | -0.44 | |||
| Danish People's Party | 126 | 0.75 | New | |||
| Leon Elmkjær | 7 | 0.04 | -0.01 | |||
| Total | 16,714 | |||||
| Source[16] | ||||||
| Parties | Vote | |||||
|---|---|---|---|---|---|---|
| Votes | % | + / - | ||||
| Venstre | 5,440 | 33.33 | +7.48 | |||
| Social Democrats | 5,405 | 33.12 | +1.01 | |||
| Conservatives | 2,116 | 12.96 | -3.51 | |||
| Progress Party | 1,258 | 7.71 | -0.99 | |||
| Green Left | 586 | 3.59 | -0.68 | |||
| Social Liberals | 524 | 3.21 | +0.30 | |||
| Christian People's Party | 388 | 2.38 | -0.46 | |||
| Centre Democrats | 307 | 1.88 | -2.03 | |||
| Red–Green Alliance | 289 | 1.77 | +1.24 | |||
| Leon Elmkjær | 8 | 0.05 | New | |||
| Total | 16,321 | |||||
| Source[17] | ||||||
| Parties | Vote | |||||
|---|---|---|---|---|---|---|
| Votes | % | + / - | ||||
| Social Democrats | 5,195 | 32.11 | +5.75 | |||
| Venstre | 4,182 | 25.85 | +3.15 | |||
| Conservatives | 2,664 | 16.47 | -3.37 | |||
| Progress Party | 1,408 | 8.70 | -2.93 | |||
| Green Left | 690 | 4.27 | -1.96 | |||
| Centre Democrats | 633 | 3.91 | +0.57 | |||
| Social Liberals | 470 | 2.91 | -1.42 | |||
| Christian People's Party | 460 | 2.84 | +0.16 | |||
| Common Course | 220 | 1.36 | +0.17 | |||
| The Greens | 89 | 0.55 | -0.46 | |||
| Red–Green Alliance | 85 | 0.53 | New | |||
| Justice Party of Denmark | 82 | 0.51 | New | |||
| Total | 16,178 | |||||
| Source[18] | ||||||
General elections in the 1980s
| Parties | Vote | |||||
|---|---|---|---|---|---|---|
| Votes | % | + / - | ||||
| Social Democrats | 4,469 | 26.36 | -1.54 | |||
| Venstre | 3,848 | 22.70 | +1.77 | |||
| Conservatives | 3,363 | 19.84 | -2.68 | |||
| Progress Party | 1,971 | 11.63 | +4.36 | |||
| Green Left | 1,056 | 6.23 | -0.69 | |||
| Social Liberals | 734 | 4.33 | -0.23 | |||
| Centre Democrats | 567 | 3.34 | -0.17 | |||
| Christian People's Party | 454 | 2.68 | -0.22 | |||
| Common Course | 202 | 1.19 | +0.07 | |||
| The Greens | 171 | 1.01 | -0.01 | |||
| Communist Party of Denmark | 86 | 0.51 | +0.06 | |||
| Left Socialists | 33 | 0.19 | -0.17 | |||
| Total | 16,954 | |||||
| Source[19] | ||||||
| Parties | Vote | |||||
|---|---|---|---|---|---|---|
| Votes | % | + / - | ||||
| Social Democrats | 4,799 | 27.90 | +1.53 | |||
| Conservatives | 3,873 | 22.52 | -5.41 | |||
| Venstre | 3,600 | 20.93 | +0.94 | |||
| Progress Party | 1,251 | 7.27 | +1.79 | |||
| Green Left | 1,190 | 6.92 | +1.26 | |||
| Social Liberals | 785 | 4.56 | +0.78 | |||
| Centre Democrats | 604 | 3.51 | -1.03 | |||
| Christian People's Party | 498 | 2.90 | -0.82 | |||
| Common Course | 193 | 1.12 | New | |||
| The Greens | 175 | 1.02 | New | |||
| Communist Party of Denmark | 78 | 0.45 | +0.11 | |||
| Justice Party of Denmark | 72 | 0.42 | -0.57 | |||
| Left Socialists | 62 | 0.36 | -0.82 | |||
| Humanist Party | 11 | 0.06 | New | |||
| Socialist Workers Party | 6 | 0.03 | 0.00 | |||
| Marxist–Leninists Party | 4 | 0.02 | +0.01 | |||
| Total | 17,201 | |||||
| Source[20] | ||||||
| Parties | Vote | |||||
|---|---|---|---|---|---|---|
| Votes | % | + / - | ||||
| Conservatives | 4,872 | 27.93 | +12.37 | |||
| Social Democrats | 4,600 | 26.37 | -2.64 | |||
| Venstre | 3,488 | 19.99 | -2.50 | |||
| Green Left | 988 | 5.66 | -0.06 | |||
| Progress Party | 956 | 5.48 | -5.37 | |||
| Centre Democrats | 792 | 4.54 | -1.16 | |||
| Social Liberals | 659 | 3.78 | -0.39 | |||
| Christian People's Party | 649 | 3.72 | +0.68 | |||
| Left Socialists | 205 | 1.18 | -0.06 | |||
| Justice Party of Denmark | 172 | 0.99 | -0.36 | |||
| Communist Party of Denmark | 59 | 0.34 | -0.38 | |||
| Socialist Workers Party | 5 | 0.03 | -0.03 | |||
| Marxist–Leninists Party | 1 | 0.01 | New | |||
| Total | 17,446 | |||||
| Source[21] | ||||||
| Parties | Vote | |||||
|---|---|---|---|---|---|---|
| Votes | % | + / - | ||||
| Social Democrats | 4,737 | 29.01 | -3.25 | |||
| Venstre | 3,672 | 22.49 | +2.54 | |||
| Conservatives | 2,541 | 15.56 | +2.02 | |||
| Progress Party | 1,771 | 10.85 | -3.12 | |||
| Green Left | 934 | 5.72 | +2.68 | |||
| Centre Democrats | 931 | 5.70 | +2.46 | |||
| Social Liberals | 681 | 4.17 | +0.24 | |||
| Christian People's Party | 497 | 3.04 | -0.96 | |||
| Justice Party of Denmark | 220 | 1.35 | -1.19 | |||
| Left Socialists | 202 | 1.24 | -0.84 | |||
| Communist Party of Denmark | 117 | 0.72 | -0.46 | |||
| Communist Workers Party | 15 | 0.09 | -0.18 | |||
| Socialist Workers Party | 10 | 0.06 | New | |||
| Total | 16,328 | |||||
| Source[22] | ||||||
General elections in the 1970s
| Parties | Vote | |||||
|---|---|---|---|---|---|---|
| Votes | % | + / - | ||||
| Social Democrats | 5,175 | 32.26 | +3.35 | |||
| Venstre | 3,201 | 19.95 | +1.43 | |||
| Progress Party | 2,241 | 13.97 | -3.58 | |||
| Conservatives | 2,172 | 13.54 | +5.18 | |||
| Christian People's Party | 642 | 4.00 | -1.09 | |||
| Social Liberals | 631 | 3.93 | +0.40 | |||
| Centre Democrats | 520 | 3.24 | -6.25 | |||
| Green Left | 487 | 3.04 | +0.92 | |||
| Justice Party of Denmark | 407 | 2.54 | -0.08 | |||
| Left Socialists | 333 | 2.08 | +0.56 | |||
| Communist Party of Denmark | 190 | 1.18 | -0.44 | |||
| Communist Workers Party | 44 | 0.27 | New | |||
| Total | 16,043 | |||||
| Source[23] | ||||||
| Parties | Vote | |||||
|---|---|---|---|---|---|---|
| Votes | % | + / - | ||||
| Social Democrats | 4,647 | 28.91 | +5.27 | |||
| Venstre | 2,977 | 18.52 | -10.72 | |||
| Progress Party | 2,821 | 17.55 | +2.08 | |||
| Centre Democrats | 1,525 | 9.49 | +2.94 | |||
| Conservatives | 1,344 | 8.36 | +2.03 | |||
| Christian People's Party | 818 | 5.09 | -1.25 | |||
| Social Liberals | 568 | 3.53 | -1.95 | |||
| Justice Party of Denmark | 421 | 2.62 | +0.78 | |||
| Green Left | 341 | 2.12 | +0.05 | |||
| Communist Party of Denmark | 260 | 1.62 | -0.12 | |||
| Left Socialists | 244 | 1.52 | +0.24 | |||
| Pensioners' Party | 106 | 0.66 | New | |||
| Total | 16,072 | |||||
| Source[24] | ||||||
| Parties | Vote | |||||
|---|---|---|---|---|---|---|
| Votes | % | + / - | ||||
| Venstre | 4,598 | 29.24 | +11.94 | |||
| Social Democrats | 3,717 | 23.64 | +2.47 | |||
| Progress Party | 2,433 | 15.47 | -1.78 | |||
| Centre Democrats | 1,030 | 6.55 | -3.93 | |||
| Christian People's Party | 997 | 6.34 | +1.16 | |||
| Conservatives | 995 | 6.33 | -3.98 | |||
| Social Liberals | 861 | 5.48 | -5.26 | |||
| Green Left | 326 | 2.07 | -0.86 | |||
| Justice Party of Denmark | 290 | 1.84 | -0.70 | |||
| Communist Party of Denmark | 274 | 1.74 | +0.54 | |||
| Left Socialists | 202 | 1.28 | +0.44 | |||
| Marinus Roth | 2 | 0.01 | -0.04 | |||
| Total | 15,725 | |||||
| Source[25] | ||||||
| Parties | Vote | |||||
|---|---|---|---|---|---|---|
| Votes | % | + / - | ||||
| Social Democrats | 3,321 | 21.17 | -9.94 | |||
| Venstre | 2,713 | 17.30 | -3.49 | |||
| Progress Party | 2,705 | 17.25 | New | |||
| Social Liberals | 1,685 | 10.74 | -2.63 | |||
| Centre Democrats | 1,644 | 10.48 | New | |||
| Conservatives | 1,617 | 10.31 | -5.84 | |||
| Christian People's Party | 813 | 5.18 | +2.34 | |||
| Green Left | 459 | 2.93 | -0.94 | |||
| Justice Party of Denmark | 399 | 2.54 | +0.68 | |||
| Communist Party of Denmark | 189 | 1.20 | +0.79 | |||
| Left Socialists | 132 | 0.84 | +0.13 | |||
| Marinus Roth | 8 | 0.05 | +0.04 | |||
| Total | 15,685 | |||||
| Source[26] | ||||||
| Parties | Vote | |||||
|---|---|---|---|---|---|---|
| Votes | % | + / - | ||||
| Social Democrats | 4,553 | 31.11 | +3.18 | |||
| Venstre | 3,043 | 20.79 | -4.73 | |||
| Conservatives | 2,364 | 16.15 | -3.00 | |||
| Social Liberals | 1,957 | 13.37 | -0.57 | |||
| Schleswig Party | 1,301 | 8.89 | +1.54 | |||
| Green Left | 566 | 3.87 | +1.57 | |||
| Christian People's Party | 416 | 2.84 | New | |||
| Justice Party of Denmark | 272 | 1.86 | +0.64 | |||
| Left Socialists | 104 | 0.71 | -0.07 | |||
| Communist Party of Denmark | 60 | 0.41 | +0.10 | |||
| Marinus Roth | 1 | 0.01 | New | |||
| Total | 14,637 | |||||
| Source[27] | ||||||
General elections in the 1960s
| Parties | Vote | |||||
|---|---|---|---|---|---|---|
| Votes | % | + / - | ||||
| Social Democrats | 4,253 | 27.93 | -7.49 | |||
| Venstre | 3,885 | 25.52 | -2.61 | |||
| Conservatives | 2,916 | 19.15 | -0.95 | |||
| Social Liberals | 2,122 | 13.94 | +6.77 | |||
| Schleswig Party | 1,119 | 7.35 | New | |||
| Green Left | 350 | 2.30 | -1.31 | |||
| Justice Party of Denmark | 186 | 1.22 | +0.09 | |||
| Independent Party | 119 | 0.78 | -1.79 | |||
| Left Socialists | 119 | 0.78 | New | |||
| Liberal Centre | 110 | 0.72 | -0.86 | |||
| Communist Party of Denmark | 47 | 0.31 | +0.01 | |||
| Total | 15,226 | |||||
| Source[28] | ||||||
| Parties | Vote | |||||
|---|---|---|---|---|---|---|
| Votes | % | + / - | ||||
| Social Democrats | 5,138 | 35.42 | +3.19 | |||
| Venstre | 4,080 | 28.13 | +1.25 | |||
| Conservatives | 2,915 | 20.10 | +2.36 | |||
| Social Liberals | 1,040 | 7.17 | +1.11 | |||
| Green Left | 524 | 3.61 | +2.06 | |||
| Independent Party | 373 | 2.57 | +0.88 | |||
| Liberal Centre | 229 | 1.58 | New | |||
| Justice Party of Denmark | 164 | 1.13 | -0.88 | |||
| Communist Party of Denmark | 43 | 0.30 | -0.12 | |||
| Total | 14,506 | |||||
| Source[29] | ||||||
| Parties | Vote | |||||
|---|---|---|---|---|---|---|
| Votes | % | + / - | ||||
| Social Democrats | 4,634 | 32.23 | +2.48 | |||
| Venstre | 3,865 | 26.88 | -1.44 | |||
| Conservatives | 2,550 | 17.74 | +1.39 | |||
| Schleswig Party | 1,587 | 11.04 | -0.73 | |||
| Social Liberals | 871 | 6.06 | -0.29 | |||
| Justice Party of Denmark | 289 | 2.01 | -0.84 | |||
| Independent Party | 243 | 1.69 | -0.69 | |||
| Green Left | 223 | 1.55 | -0.13 | |||
| Communist Party of Denmark | 61 | 0.42 | -0.13 | |||
| Danish Unity | 54 | 0.38 | New | |||
| Total | 14,377 | |||||
| Source[30] | ||||||
| Parties | Vote | |||||
|---|---|---|---|---|---|---|
| Votes | % | + / - | ||||
| Social Democrats | 3,993 | 29.75 | +3.22 | |||
| Venstre | 3,800 | 28.32 | -3.62 | |||
| Conservatives | 2,194 | 16.35 | +1.25 | |||
| Schleswig Party | 1,580 | 11.77 | -0.16 | |||
| Social Liberals | 852 | 6.35 | -0.27 | |||
| Justice Party of Denmark | 383 | 2.85 | -2.34 | |||
| Independent Party | 319 | 2.38 | +0.88 | |||
| Green Left | 225 | 1.68 | New | |||
| Communist Party of Denmark | 74 | 0.55 | -0.65 | |||
| Total | 13,420 | |||||
| Source[31] | ||||||
General elections in the 1950s
| Parties | Vote | |||||
|---|---|---|---|---|---|---|
| Votes | % | + / - | ||||
| Venstre | 4,186 | 31.94 | +1.47 | |||
| Social Democrats | 3,476 | 26.53 | -1.40 | |||
| Conservatives | 1,979 | 15.10 | +0.13 | |||
| Schleswig Party | 1,563 | 11.93 | New | |||
| Social Liberals | 867 | 6.62 | +0.61 | |||
| Justice Party of Denmark | 680 | 5.19 | +1.06 | |||
| Independent Party | 196 | 1.50 | -0.02 | |||
| Communist Party of Denmark | 157 | 1.20 | -0.37 | |||
| Total | 13,104 | |||||
| Source[32] | ||||||
September 1953 Danish Folketing election
| Parties | Vote | |||||
|---|---|---|---|---|---|---|
| Votes | % | + / - | ||||
| Venstre | 3,813 | 30.47 | +2.12 | |||
| Social Democrats | 3,495 | 27.93 | -0.37 | |||
| Conservatives | 1,873 | 14.97 | -1.03 | |||
| Hans Schmidt | 1,676 | 13.40 | +1.21 | |||
| Social Liberals | 752 | 6.01 | -0.49 | |||
| Justice Party of Denmark | 517 | 4.13 | -1.67 | |||
| Communist Party of Denmark | 196 | 1.57 | -0.54 | |||
| Independent Party | 190 | 1.52 | New | |||
| Total | 12,512 | |||||
| Source[33] | ||||||
April 1953 Danish Folketing election
| Parties | Vote | |||||
|---|---|---|---|---|---|---|
| Votes | % | + / - | ||||
| Venstre | 3,316 | 28.35 | -0.73 | |||
| Social Democrats | 3,310 | 28.30 | +0.04 | |||
| Conservatives | 1,871 | 16.00 | +0.94 | |||
| Hans Schmidt | 1,426 | 12.19 | +2.47 | |||
| Social Liberals | 760 | 6.50 | +0.45 | |||
| Justice Party of Denmark | 678 | 5.80 | -3.90 | |||
| Communist Party of Denmark | 247 | 2.11 | -0.01 | |||
| Danish Unity | 88 | 0.75 | New | |||
| Total | 11,696 | |||||
| Source[34] | ||||||
1950 Danish Folketing election
| Parties | Vote | |||||
|---|---|---|---|---|---|---|
| Votes | % | + / - | ||||
| Venstre | 3,380 | 29.08 | -5.58 | |||
| Social Democrats | 3,285 | 28.26 | -0.07 | |||
| Conservatives | 1,751 | 15.06 | +4.79 | |||
| Hans Schmidt | 1,130 | 9.72 | New | |||
| Justice Party of Denmark | 1,128 | 9.70 | +4.85 | |||
| Social Liberals | 703 | 6.05 | +1.59 | |||
| Communist Party of Denmark | 246 | 2.12 | -0.38 | |||
| Total | 11,623 | |||||
| Source[35] | ||||||
General elections in the 1940s
1947 Danish Folketing election
| Parties | Vote | |||||
|---|---|---|---|---|---|---|
| Votes | % | + / - | ||||
| Venstre | 4,098 | 34.66 | -5.02 | |||
| Social Democrats | 3,349 | 28.33 | +1.50 | |||
| W. Reuter | 1,222 | 10.34 | New | |||
| Conservatives | 1,214 | 10.27 | -4.98 | |||
| Justice Party of Denmark | 574 | 4.85 | +1.73 | |||
| Social Liberals | 527 | 4.46 | -4.00 | |||
| J. Christmas Møller | 438 | 3.70 | New | |||
| Communist Party of Denmark | 296 | 2.50 | -1.27 | |||
| Danish Unity | 105 | 0.89 | -1.99 | |||
| Total | 11,823 | |||||
| Source[36] | ||||||
1945 Danish Folketing election
| Parties | Vote | |||||
|---|---|---|---|---|---|---|
| Votes | % | + / - | ||||
| Venstre | 4,539 | 39.68 | +11.85 | |||
| Social Democrats | 3,069 | 26.83 | -7.60 | |||
| Conservatives | 1,745 | 15.25 | -4.14 | |||
| Social Liberals | 968 | 8.46 | +1.24 | |||
| Communist Party of Denmark | 431 | 3.77 | New | |||
| Justice Party of Denmark | 357 | 3.12 | +0.03 | |||
| Danish Unity | 330 | 2.88 | +1.80 | |||
| Total | 11,439 | |||||
| Source[37] | ||||||
1943 Danish Folketing election
| Parties | Vote | |||||
|---|---|---|---|---|---|---|
| Votes | % | + / - | ||||
| Social Democrats | 3,521 | 34.43 | -0.32 | |||
| Venstre | 2,846 | 27.83 | +4.27 | |||
| Conservatives | 1,983 | 19.39 | +1.39 | |||
| Social Liberals | 738 | 7.22 | +1.37 | |||
| National Socialist Workers' Party of Denmark | 499 | 4.88 | +0.49 | |||
| Justice Party of Denmark | 316 | 3.09 | +1.64 | |||
| Farmers' Party | 215 | 2.10 | New | |||
| Danish Unity | 110 | 1.08 | New | |||
| Total | 10,228 | |||||
| Source[38] | ||||||
General elections in the 1930s
1939 Danish Folketing election
| Parties | Vote | |||||
|---|---|---|---|---|---|---|
| Votes | % | + / - | ||||
| Social Democrats | 4,011 | 34.75 | +7.50 | |||
| Venstre | 2,719 | 23.56 | +7.23 | |||
| Conservatives | 2,078 | 18.00 | +2.10 | |||
| Schleswig Party | 1,327 | 11.50 | -7.68 | |||
| Social Liberals | 675 | 5.85 | +0.57 | |||
| National Socialist Workers' Party of Denmark | 507 | 4.39 | -1.31 | |||
| Justice Party of Denmark | 167 | 1.45 | -2.47 | |||
| National Cooperation | 59 | 0.51 | New | |||
| Total | 11,543 | |||||
| Source[39] | ||||||
1935 Danish Folketing election
| Parties | Vote | |||||
|---|---|---|---|---|---|---|
| Votes | % | + / - | ||||
| Social Democrats | 2,962 | 27.25 | +3.62 | |||
| Schleswig Party | 2,085 | 19.18 | +1.94 | |||
| Venstre | 1,775 | 16.33 | -7.48 | |||
| Conservatives | 1,728 | 15.90 | -5.72 | |||
| National Socialist Workers' Party of Denmark | 620 | 5.70 | New | |||
| Independent People's Party | 587 | 5.40 | New | |||
| Social Liberals | 574 | 5.28 | -2.36 | |||
| Justice Party of Denmark | 426 | 3.92 | -0.81 | |||
| Communist Party of Denmark | 93 | 0.86 | -0.46 | |||
| Society Party | 21 | 0.19 | New | |||
| Total | 10,871 | |||||
| Source[40] | ||||||
1932 Danish Folketing election
| Parties | Vote | |||||
|---|---|---|---|---|---|---|
| Votes | % | + / - | ||||
| Venstre | 2,389 | 23.81 | -8.24 | |||
| Social Democrats | 2,371 | 23.63 | +1.23 | |||
| Conservatives | 2,169 | 21.62 | +3.55 | |||
| Schleswig Party | 1,730 | 17.24 | -1.54 | |||
| Social Liberals | 766 | 7.64 | +1.91 | |||
| Justice Party of Denmark | 475 | 4.73 | +1.92 | |||
| Communist Party of Denmark | 132 | 1.32 | +1.16 | |||
| Total | 10,032 | |||||
| Source[41] | ||||||
General elections in the 1920s
1929 Danish Folketing election
| Parties | Vote | |||||
|---|---|---|---|---|---|---|
| Votes | % | + / - | ||||
| Venstre | 3,035 | 32.05 | -3.05 | |||
| Social Democrats | 2,121 | 22.40 | +5.01 | |||
| Schleswig Party | 1,778 | 18.78 | -0.11 | |||
| Conservatives | 1,711 | 18.07 | +0.57 | |||
| Social Liberals | 543 | 5.73 | -0.50 | |||
| Justice Party of Denmark | 266 | 2.81 | +1.30 | |||
| Communist Party of Denmark | 15 | 0.16 | -0.05 | |||
| Total | 9,469 | |||||
| Source[42] | ||||||
1926 Danish Folketing election
| Parties | Vote | |||||
|---|---|---|---|---|---|---|
| Votes | % | + / - | ||||
| Venstre | 3,398 | 35.10 | +2.97 | |||
| Schleswig Party | 1,829 | 18.89 | +1.14 | |||
| Conservatives | 1,694 | 17.50 | -5.02 | |||
| Social Democrats | 1,684 | 17.39 | +1.34 | |||
| Social Liberals | 603 | 6.23 | -3.41 | |||
| Independence Party | 307 | 3.17 | New | |||
| Justice Party of Denmark | 146 | 1.51 | +1.31 | |||
| Communist Party of Denmark | 20 | 0.21 | New | |||
| Total | 9,681 | |||||
| Source[43] | ||||||
1924 Danish Folketing election
| Parties | Vote | |||||
|---|---|---|---|---|---|---|
| Votes | % | + / - | ||||
| Venstre | 2,665 | 32.13 | -11.96 | |||
| Conservatives | 1,868 | 22.52 | -0.34 | |||
| Schleswig Party | 1,472 | 17.75 | -0.24 | |||
| Social Democrats | 1,331 | 16.05 | +8.12 | |||
| Social Liberals | 800 | 9.64 | +4.18 | |||
| Farmer Party | 142 | 1.71 | New | |||
| Justice Party of Denmark | 17 | 0.20 | New | |||
| Total | 8,295 | |||||
| Source[44] | ||||||
September 1920 Danish Folketing election
| Parties | Vote | |||||
|---|---|---|---|---|---|---|
| Votes | % | + / - | ||||
| Venstre | 3,384 | 44.09 | ||||
| Conservatives | 1,755 | 22.86 | ||||
| Schleswig Party | 1,381 | 17.99 | ||||
| Social Democrats | 609 | 7.93 | ||||
| Social Liberals | 419 | 5.46 | ||||
| Industry Party | 72 | 0.94 | ||||
| Danish Left Socialist Party | 56 | 0.73 | ||||
| Total | 7,676 | |||||
| Source[45] | ||||||
European Parliament elections results
2019 European Parliament election in Denmark
| Parties | Vote | |||||
|---|---|---|---|---|---|---|
| Votes | % | + / - | ||||
| Venstre | 5,439 | 32.45 | +6.55 | |||
| Social Democrats | 3,434 | 20.49 | +4.59 | |||
| Danish People's Party | 2,878 | 17.17 | -13.84 | |||
| Green Left | 1,265 | 7.55 | +1.55 | |||
| Social Liberals | 975 | 5.82 | +2.74 | |||
| Conservatives | 796 | 4.75 | -5.84 | |||
| Liberal Alliance | 763 | 4.55 | +2.11 | |||
| People's Movement against the EU | 512 | 3.05 | -2.03 | |||
| Red–Green Alliance | 457 | 2.73 | New | |||
| The Alternative | 241 | 1.44 | New | |||
| Total | 16,760 | |||||
| Source[46] | ||||||
2014 European Parliament election in Denmark
| Parties | Vote | |||||
|---|---|---|---|---|---|---|
| Votes | % | + / - | ||||
| Danish People's Party | 4,524 | 31.01 | +14.97 | |||
| Venstre | 3,779 | 25.90 | -5.47 | |||
| Social Democrats | 2,319 | 15.90 | -1.34 | |||
| Conservatives | 1,545 | 10.59 | -3.69 | |||
| Green Left | 875 | 6.00 | -4.63 | |||
| People's Movement against the EU | 741 | 5.08 | -0.10 | |||
| Social Liberals | 449 | 3.08 | +0.30 | |||
| Liberal Alliance | 356 | 2.44 | +2.12 | |||
| Total | 14,588 | |||||
| Source[47] | ||||||
2009 European Parliament election in Denmark
| Parties | Vote | |||||
|---|---|---|---|---|---|---|
| Votes | % | + / - | ||||
| Venstre | 4,943 | 31.37 | +3.27 | |||
| Social Democrats | 2,717 | 17.24 | -16.57 | |||
| Danish People's Party | 2,528 | 16.04 | +10.02 | |||
| Conservatives | 2,251 | 14.28 | +4.26 | |||
| Green Left | 1,675 | 10.63 | +5.97 | |||
| People's Movement against the EU | 817 | 5.18 | +1.49 | |||
| Social Liberals | 438 | 2.78 | -0.69 | |||
| June Movement | 339 | 2.15 | -6.80 | |||
| Liberal Alliance | 50 | 0.32 | New | |||
| Total | 15,758 | |||||
| Source[48] | ||||||
2004 European Parliament election in Denmark
| Parties | Vote | |||||
|---|---|---|---|---|---|---|
| Votes | % | + / - | ||||
| Social Democrats | 2,950 | 33.81 | +19.53 | |||
| Venstre | 2,452 | 28.10 | -1.63 | |||
| Conservatives | 874 | 10.02 | -3.65 | |||
| June Movement | 781 | 8.95 | -5.94 | |||
| Danish People's Party | 525 | 6.02 | +1.75 | |||
| Green Left | 407 | 4.66 | +0.83 | |||
| People's Movement against the EU | 322 | 3.69 | -3.27 | |||
| Social Liberals | 303 | 3.47 | -3.35 | |||
| Christian Democrats | 111 | 1.27 | -0.74 | |||
| Total | 8,725 | |||||
| Source[49] | ||||||
1999 European Parliament election in Denmark
| Parties | Vote | |||||
|---|---|---|---|---|---|---|
| Votes | % | + / - | ||||
| Venstre | 2,554 | 29.73 | +1.93 | |||
| June Movement | 1,279 | 14.89 | +4.89 | |||
| Social Democrats | 1,227 | 14.28 | -1.08 | |||
| Conservatives | 1,174 | 13.67 | -8.14 | |||
| People's Movement against the EU | 598 | 6.96 | -2.72 | |||
| Social Liberals | 586 | 6.82 | +1.92 | |||
| Danish People's Party | 367 | 4.27 | New | |||
| Green Left | 329 | 3.83 | -0.80 | |||
| Centre Democrats | 304 | 3.54 | +2.75 | |||
| Christian Democrats | 173 | 2.01 | +0.54 | |||
| Progress Party | 127 | 1.48 | -2.10 | |||
| Total | 8,591 | |||||
| Source[50] | ||||||
1994 European Parliament election in Denmark
| Parties | Vote | |||||
|---|---|---|---|---|---|---|
| Votes | % | + / - | ||||
| Venstre | 2,853 | 27.80 | -1.43 | |||
| Conservatives | 2,238 | 21.81 | +8.20 | |||
| Social Democrats | 1,576 | 15.36 | -6.63 | |||
| June Movement | 1,026 | 10.00 | New | |||
| People's Movement against the EU | 993 | 9.68 | -0.38 | |||
| Social Liberals | 503 | 4.90 | +2.24 | |||
| Green Left | 475 | 4.63 | +0.43 | |||
| Progress Party | 367 | 3.58 | -3.54 | |||
| Christian Democrats | 151 | 1.47 | -1.51 | |||
| Centre Democrats | 81 | 0.79 | -7.35 | |||
| Total | 10,263 | |||||
| Source[51] | ||||||
1989 European Parliament election in Denmark
| Parties | Vote | |||||
|---|---|---|---|---|---|---|
| Votes | % | + / - | ||||
| Venstre | 2,635 | 29.23 | +5.65 | |||
| Social Democrats | 1,982 | 21.99 | +4.73 | |||
| Conservatives | 1,227 | 13.61 | -9.92 | |||
| People's Movement against the EU | 907 | 10.06 | -2.81 | |||
| Centre Democrats | 734 | 8.14 | +0.52 | |||
| Progress Party | 642 | 7.12 | +3.13 | |||
| Green Left | 379 | 4.20 | +0.13 | |||
| Christian Democrats | 269 | 2.98 | -0.63 | |||
| Social Liberals | 240 | 2.66 | -0.37 | |||
| Total | 9,015 | |||||
| Source[52] | ||||||
1984 European Parliament election in Denmark
| Parties | Vote | |||||
|---|---|---|---|---|---|---|
| Votes | % | |||||
| Venstre | 2,493 | 23.58 | ||||
| Conservatives | 2,488 | 23.53 | ||||
| Social Democrats | 1,825 | 17.26 | ||||
| People's Movement against the EU | 1,361 | 12.87 | ||||
| Centre Democrats | 806 | 7.62 | ||||
| Green Left | 430 | 4.07 | ||||
| Progress Party | 422 | 3.99 | ||||
| Christian Democrats | 382 | 3.61 | ||||
| Social Liberals | 320 | 3.03 | ||||
| Left Socialists | 47 | 0.44 | ||||
| Total | 10,574 | |||||
| Source[53] | ||||||
Referendums
2022 Danish European Union opt-out referendum[54]
| Option | Votes | % |
|---|---|---|
| ✓ YES | 10,295 | 60.58 |
| X NO | 6,700 | 39.42 |
2015 Danish European Union opt-out referendum[55]
| Option | Votes | % |
|---|---|---|
| X NO | 11,080 | 55.50 |
| ✓ YES | 8,885 | 44.50 |
2014 Danish Unified Patent Court membership referendum[56]
| Option | Votes | % |
|---|---|---|
| ✓ YES | 9,408 | 66.19 |
| X NO | 4,805 | 33.81 |
2009 Danish Act of Succession referendum[57]
| Option | Votes | % |
|---|---|---|
| ✓ YES | 12,833 | 84.49 |
| X NO | 2,355 | 15.51 |
2000 Danish euro referendum[58]
| Option | Votes | % |
|---|---|---|
| X NO | 8,877 | 52.36 |
| ✓ YES | 8,077 | 47.64 |
1998 Danish Amsterdam Treaty referendum[59]
| Option | Votes | % |
|---|---|---|
| ✓ YES | 8,611 | 57.54 |
| X NO | 6,355 | 42.46 |
1993 Danish Maastricht Treaty referendum[60]
| Option | Votes | % |
|---|---|---|
| ✓ YES | 10,582 | 62.36 |
| X NO | 6,386 | 37.64 |
1992 Danish Maastricht Treaty referendum[61]
| Option | Votes | % |
|---|---|---|
| ✓ YES | 9,018 | 56.32 |
| X NO | 6,994 | 43.68 |
1986 Danish Single European Act referendum[62]
| Option | Votes | % |
|---|---|---|
| ✓ YES | 15,415 | 58.12 |
| X NO | 11,107 | 41.88 |
1972 Danish European Communities membership referendum[63]
| Option | Votes | % |
|---|---|---|
| ✓ YES | 12,319 | 77.10 |
| X NO | 3,659 | 22.90 |
1953 Danish constitutional and electoral age referendum[64]
| Option | Votes | % |
|---|---|---|
| ✓ YES | 7,102 | 87.12 |
| X NO | 1,050 | 12.88 |
| 23 years | 5,374 | 64.15 |
| 21 years | 3,003 | 35.85 |
1939 Danish constitutional referendum[65]
| Option | Votes | % |
|---|---|---|
| ✓ YES | 3,573 | 91.80 |
| X NO | 319 | 8.20 |
References
- ↑ "Tønderkredsen". kmdvalg.dk (in Danish). Retrieved 2023-06-04.
- ↑ "Forslag til Lov om de sønderjyske Landsdeles Repræsentation i Rigsdagen m.v.". Rigsdagstidende. 1919-20 (anden samling): Tillæg C, spalte 25 ff.
- ↑ "Nye valgkredse fordeler stemmerne anderledes". dr.dk (in Danish). Retrieved 2023-06-04.
- ↑ "Beretning om nye valgkredse som følge af kommunalreformen" (in Danish). Retrieved 2023-06-04.
- ↑ "Det danske valgsystem: Valg til Folketinget". valg.im (in Danish). Retrieved 2023-06-04.
- ↑ "51 Tønder". dataforsyningen.dk (in Danish). Retrieved 2023-06-04.
- ↑ "Forslag til Lov om de sønderjyske Landsdeles Repræsentation i Rigsdagen m.v.". Rigsdagstidende. 1919-20 (anden samling): Tillæg C, spalte 25 ff.
- ↑ "Valgresultater fra tidligere valg:". kmdvalg (in Danish). Retrieved 2023-06-04.
- ↑ "FOLKETINGSVALG TIRSDAG 1. NOVEMBER 2022". valg.im (in Danish). Retrieved 2023-06-27.
- ↑ "FOLKETINGSVALG ONSDAG 5. JUNI 2019". valg.im (in Danish). Retrieved 2023-06-27.
- ↑ "FOLKETINGSVALG TORSDAG 18. JUNI 2015". valg.im (in Danish). Retrieved 2023-06-27.
- ↑ "FOLKETINGSVALG TORSDAG 15. SEPTEMBER 2011". valg.im (in Danish). Retrieved 2023-06-27.
- ↑ "Folketingsvalget den 13. november 2007". valg.im (in Danish). Retrieved 2023-06-27.
- ↑ "valg2005.book" (PDF). valg.im (in Danish). Retrieved 2023-06-27.
- ↑ "BMTABEL" (PDF). valg.im (in Danish). Retrieved 2023-06-27.
- ↑ "VALG98" (PDF). valg.im (in Danish). Retrieved 2023-06-27.
- ↑ "VALG94" (PDF). valg.im (in Danish). Retrieved 2023-06-27.
- ↑ "VALG90" (PDF). valg.im (in Danish). Retrieved 2023-06-27.
- ↑ "Folketingsvalget den 10. maj 1988". valg.im (in Danish). Retrieved 2023-06-27.
- ↑ "Folketingsvalget den 8.september 1987". dst.dk (in Danish). Retrieved 2023-06-27.
- ↑ "Folketingsvalget den 10. januar 1984". dst.dk (in Danish). Retrieved 2023-06-27.
- ↑ "Folketingsvalget den 8. december 1981". dst.dk (in Danish). Retrieved 2023-06-27.
- ↑ "Folketingsvalget den 23. oktober 1979". dst.dk (in Danish). Retrieved 2023-06-27.
- ↑ "Folketingsvalget den 15. februar 1977". dst.dk (in Danish). Retrieved 2023-06-27.
- ↑ "Folketingsvalget den 9. januar 1975". dst.dk (in Danish). Retrieved 2023-06-27.
- ↑ "Folketingsvalget den 4. december 1973". dst.dk (in Danish). Retrieved 2023-06-27.
- ↑ "Folketingsvalget den 21. september 1971 samt folkeafstemningen". dst.dk (in Danish). Retrieved 2023-06-27.
- ↑ "Folketingsvalget den 23. januar 1968". dst.dk (in Danish). Retrieved 2023-06-27.
- ↑ "Folketingsvalget den 22. november 1966". dst.dk (in Danish). Retrieved 2023-06-27.
- ↑ "Folketingsvalget den 22. september 1964". dst.dk (in Danish). Retrieved 2023-06-27.
- ↑ "Folketingsvalget den 15. november 1960". dst.dk (in Danish). Retrieved 2023-06-27.
- ↑ "Folketingsvalget den 14. maj 1957". dst.dk (in Danish). Retrieved 2023-06-27.
- ↑ "Folketingsvalget den 22. september 1953". dst.dk (in Danish). Retrieved 2023-06-27.
- ↑ "Rigsdagsvalgene og folkeafstemningerne i april og maj 1953". dst.dk (in Danish). Retrieved 2023-06-27.
- ↑ "Folketingsvalget den 5. september 1950". dst.dk (in Danish). Retrieved 2023-06-27.
- ↑ "Folketingsvalget den 28. oktober 1947". dst.dk (in Danish). Retrieved 2023-06-27.
- ↑ "Rigsdagsvalgene i oktober og november 1945". dst.dk (in Danish). Retrieved 2023-06-27.
- ↑ "Rigsdagsvalgene i marts og april 1943". dst.dk (in Danish). Retrieved 2023-06-27.
- ↑ "Rigsdagsvalgene og Folkeafstemningen i april og maj 1939". dst.dk (in Danish). Retrieved 2023-06-27.
- ↑ "Folketingsvalget den 22. oktober 1935". dst.dk (in Danish). Retrieved 2023-06-27.
- ↑ "Folketingsvalget den 16. november 1932". dst.dk (in Danish). Retrieved 2023-06-27.
- ↑ "Folketingsvalget den 24. april 1929". dst.dk (in Danish). Retrieved 2023-06-27.
- ↑ "Folketingsvalget den 2. december 1926". dst.dk (in Danish). Retrieved 2023-06-27.
- ↑ "Folketingsvalget den 11. april 1924". dst.dk (in Danish). Retrieved 2023-06-27.
- ↑ "Rigsdagsvalgene september-oktober 1920". dst.dk (in Danish). Retrieved 2023-06-27.
- ↑ "EUROPA-PARLAMENTSVALG SØNDAG 26. MAJ 2019". dst.dk (in Danish). Retrieved 2023-07-01.
- ↑ "EUROPA-PARLAMENTSVALG SØNDAG 25. MAJ 2014". dst.dk (in Danish). Retrieved 2023-07-01.
- ↑ "EUROPA-PARLAMENTSVALG SØNDAG 7. JUNI 2009". dst.dk (in Danish). Retrieved 2023-07-01.
- ↑ "EUROPA-PARLAMENTSVALGET DEN 13. JUNI 2004" (PDF). im.dk (in Danish). Retrieved 2023-07-01.
- ↑ "VALGET TIL EUROPA-PARLAMENTET DEN 10. JUNI 1999" (PDF). im.dk (in Danish). Retrieved 2023-07-01.
- ↑ "VALGET TIL EUROPA-PARLAMENTET DEN 9. JUNI 1994" (PDF). im.dk (in Danish). Retrieved 2023-07-01.
- ↑ "Valget til Europa-parlamentet den 15. juni 1989". dst.dk (in Danish). Retrieved 2023-07-01.
- ↑ "Valget til Europa-Parlamentet den 14. juni 1984". dst.dk (in Danish). Retrieved 2023-07-01.
- ↑ "FOLKEAFSTEMNING ONSDAG 1. JUNI 2022". dst.dk (in Danish). Retrieved 2023-07-05.
- ↑ "FOLKEAFSTEMNING TORSDAG 3. DECEMBER 2015". dst.dk (in Danish). Retrieved 2023-07-05.
- ↑ "FOLKEAFSTEMNING SØNDAG 25. MAJ 2014". dst.dk (in Danish). Retrieved 2023-07-05.
- ↑ "FOLKEAFSTEMNING SØNDAG 7. JUNI 2009". dst.dk (in Danish). Retrieved 2023-07-05.
- ↑ "FOLKEAFSTEMNINGEN DEN 28. SEPTEMBER 2000 OM DANMARKS DELTAGELSE I DEN FÆLLES VALUTA" (PDF). valg.im (in Danish). Retrieved 2023-07-05.
- ↑ "FOLKEAFSTEMNINGEN DEN 28. MAJ 1998OM DANMARKS TILTRÆDELSE AF AMSTERDAMTRAKTATEN" (PDF). valg.im (in Danish). Retrieved 2023-07-05.
- ↑ "FOLKEAFSTEMNINGEN DEN 18. MAJ 1993 OM DANMARKS TILTRÆDELSE AF EDINBURGH-AFGØRELSEN OG MAASTRICHT-TRAKTATEN". dst.dk (in Danish). Retrieved 2023-07-05.
- ↑ "Folkeafstemningen den 1. juni 1992 om Danmarks tiltrædelse af traktaten om Den Europæiske Union". dst.dk (in Danish). Retrieved 2023-07-05.
- ↑ "Vejledende folkeafstemning torsdag den 27. februar 1986 om Danmarks tiltrædelse af EF- pakken". dst.dk (in Danish). Retrieved 2023-07-05.
- ↑ "Folkeafstemningen om Danmarks tiltrædelse af De europæiske Fælleskaber 2. oktober 1972". dst.dk (in Danish). Retrieved 2023-07-05.
- ↑ "Publikationsfortegnelse vedrørende Folkeafstemninger". dst.dk (in Danish). Retrieved 2023-07-05.
- ↑ "Publikationsfortegnelse vedrørende Folkeafstemninger". dst.dk (in Danish). Retrieved 2023-07-05.