The Storm Prediction Center issues daily outlooks denoting the risk for severe weather and wildfires for specific regions in the United States. For severe weather, which includes the risk for thunderstorms, tornadoes, hail, and straight-line winds, there are five risk levels indicating the probability for these hazards: marginal, slight, enhanced, moderate, and high. For wildfires, there are three risk levels: elevated, critical, and extremely critical.[1]
Although outlooks issued by the Storm Prediction Center indicate the severity of a convective or wildfire threat, they do not always come to fruition. There have been many instances where a high risk outlook did not verify and only a few tornadoes occurred.[2] Conversely, there have been days where a lower risk level was issued and a major tornado outbreak occurred. Some of the deadliest severe weather and wildfire days in recent history did not have a high risk or extremely critical outlook issued. For example, the 2011 Joplin tornado, which killed 158 people occurred on a moderate risk day,[3] as did the tornado outbreak of December 10–11, 2021, which killed 89 people.[4] Furthermore, both the October 2017 Northern California wildfires, which killed 44 people,[5] and the 2023 Hawaii wildfires, which killed 100 people occurred under a critical fire weather outlook.[6]
The following are lists of the deadliest days in which various risk levels were issued for severe weather and wildfires.
Deadliest severe weather outlooks
Note: Fatality totals include deaths that took place in regions outside of the delineated outlook zones. Furthermore, only direct tornadic fatalities that occurred on the day that the outlook was issued for are included.
Slight risk days
| Fatalities | Event | Outlook | Region | Date |
|---|---|---|---|---|
| 30 | Saragosa tornado[7] | 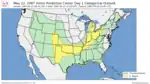 |
Central and Midwestern U.S. | May 22, 1987 |
| 24 | Evansville tornado outbreak[8] |  |
Midwestern U.S. | November 6, 2005 |
| Tornado outbreak of March 2–3[9] |  |
Middle Mississippi River Valley | March 3, 2020 | |
| 21 | Groundhog Day tornado outbreak[10] |  |
Southeastern U.S. | February 2, 2007 |
| 17 | Tornado outbreak of December 10–11[11] |  |
Eastern U.S. | December 11, 2021 |
| 9 | Super Tuesday tornado outbreak[12] |  |
Eastern U.S. | February 6, 2008 |
| New Year's Eve tornado outbreak[13] |  |
Mississippi River Valley | December 31, 2010 | |
| 8 | Tornado outbreak of April 20[14] |  |
Midwestern U.S. | April 20, 2004 |
| Tornado outbreak of November 14–16[15] |  |
Southeastern U.S. | November 16, 2006 | |
| 7 | Tornado outbreak of March 15[16] | 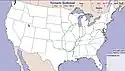 |
Midwestern U.S. | March 15, 1984 |
Enhanced risk days
Note: Enhanced risks have only been issued since October 22, 2014.
| Fatalities | Event | Outlook | Region | Date |
|---|---|---|---|---|
| 23 | Tornado outbreak of March 3[17] |  |
Southeastern U.S. | March 3, 2019 |
| 13 | Tornado outbreak of December 26–28[18] |  |
Central U.S. | December 26, 2015 |
| 10 | Easter tornado outbreak[19] |  |
Southeastern U.S. | April 13, 2020 |
| 8 | Tornado outbreak of January 12[20] |  |
Southeastern U.S. | January 12, 2023 |
| 7 | Tornado outbreak of March 5–7[21] |  |
Midwestern U.S. | March 5, 2022 |
| Tornado outbreak of December 9–10[22] |  |
Middle Mississippi River Valley | December 9, 2023 | |
| 6 | Tornado outbreak of January 10–11[23] |  |
Southeastern U.S. | January 11, 2020 |
| Tornado outbreak of April 22–23[24] |  |
Central U.S. | April 22, 2020 | |
| 5 | Tornado outbreak of December 23–24[25] |  |
Southeastern U.S. | December 23, 2014 |
| Tornado outbreak of April 4–5[26] |  |
Ohio River Valley | April 5, 2023 |
Moderate risk days
| Fatalities | Event | Outlook | Region | Date |
|---|---|---|---|---|
| 159 | Tornado outbreak sequence of May 21–26[3] |  |
Midwestern U.S. | May 22, 2011 |
| 76 | United States–Canada tornado outbreak[27] | 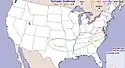 |
Northeastern U.S., Great Lakes region | May 31, 1985 |
| 72 | Tornado outbreak of December 10–11[4] |  |
Middle Mississippi River Valley | December 10, 2021 |
| 42 | Kissimmee tornado outbreak[28] |  |
Southeastern U.S. | February 22, 1998 |
| 29 | Plainfield tornado[29] |  |
Midwestern U.S., Great Lakes region | August 28, 1990 |
| 28 | Central Texas tornado outbreak[30] |  |
Central U.S. | May 27, 1997 |
| 27 | March 1997 tornado outbreak[31] | 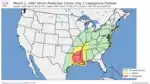 |
Central U.S. | March 1, 1997 |
| Tornado outbreak of April 2[32] | 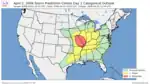 |
Midwestern U.S. | April 2, 2006 | |
| 24 | Tornado outbreak of May 18–21[33] |  |
Central U.S. | May 20, 2013 |
| 22 | Easter tornado outbreak[34] |  |
Southeastern U.S. | April 12, 2020 |
| Tornado outbreak of March 24–27[35] |  |
Central U.S. | March 24, 2023 |
High risk days
| Fatalities | Event | Outlook | Region | Date |
|---|---|---|---|---|
| 316 | Super Outbreak[36] |  |
Southeastern U.S. | April 27, 2011 |
| 57 | Carolinas tornado outbreak[37] |  |
Southeastern U.S. | March 28, 1984 |
| 48 | Super Tuesday tornado outbreak[38] |  |
Middle Mississippi River Valley | February 5, 2008 |
| 46 | Oklahoma tornado outbreak[39] |  |
Central U.S. | May 3, 1999 |
| 41 | Tornado outbreak of March 2–3[40] |  |
Ohio River Valley | March 2, 2012 |
| 40 | Palm Sunday tornado outbreak[41] |  |
Southeastern U.S. | March 27, 1994 |
| 38 | Tornado outbreak sequence of May 2003[42] | 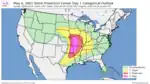 |
Central U.S. | May 4, 2003 |
| 35 | Tornado outbreak of April 6–9[43] | 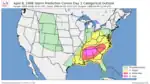 |
Southeastern U.S. | April 8, 1998 |
| 34 | Tornado outbreak of November 9–11[44] |  |
Southeastern U.S., Ohio River Valley | November 10, 2002 |
| 27 | Tornado outbreak of April 2–3[45][46] | 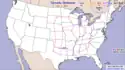 |
Central and Midwestern U.S. | April 2, 1982 |
Deadliest fire weather outlooks
Note: Fatality totals include deaths that took place in regions outside of the delineated outlook zones. Furthermore, only direct wildfire fatalities that occurred on the day that the outlook was issued for are included.
Critical days
| Fatalities | Event | Outlook | Region | Date |
|---|---|---|---|---|
| 100 | 2023 Hawaii wildfires[6] | 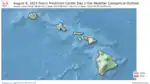 |
Hawaii | August 8, 2023 |
| 31 | October 2017 Northern California wildfires[5] |  |
Western U.S. | October 8, 2017 |
| 19 | Yarnell Hill Fire[47] |  |
Southwestern U.S. | June 30, 2013 |
| 16 | North Complex Fire[48] | 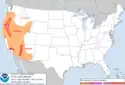 |
Northwestern and Southwestern U.S. | September 9, 2020 |
| 13 | October 2017 Northern California wildfires[49] |  |
Southwestern U.S. | October 9, 2017 |
| 12 | Cedar Fire[50] |  |
Southwestern U.S. | October 25, 2003 |
Extremely critical days
| Fatalities | Event | Outlook | Region | Date |
|---|---|---|---|---|
| 85 | Camp Fire[51] |  |
Southwestern U.S. | November 8, 2018 |
| 12 | Texas–Oklahoma wildfires[52] | 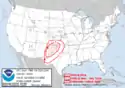 |
Great Plains region | March 12, 2006 |
| 10[53] | September 2020 Labor Day wildfires[54] |  |
Northwestern U.S. | September 8, 2020 |
| 7 | March 2017 Great Plains wildfires[55] |  |
Great Plains region | March 6, 2017 |
| 4 | April 2009 Texas wildfires[56] | 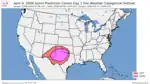 |
Great Plains region | April 9, 2009 |
See also
References
- ↑ Chris Hayes Novy (March 25, 2010). "SPC and its Products: Convective Outlooks". Storm Prediction Center. National Oceanic and Atmospheric Administration. Retrieved December 26, 2022.
- ↑ Henson, Bob. "What Happened—and Didn't Happen—with the May 20–21 High-Risk Outbreak". Weather Underground. Retrieved December 26, 2022.
- 1 2 Storm Prediction Center May 22, 2011 2000 UTC Day 1 Convective Outlook
- 1 2 Storm Prediction Center December 10, 2021 2000 UTC Day 1 Convective Outlook
- 1 2 Storm Prediction Center October 8, 2017 0657 UTC Day 1 Fire Weather Outlook
- 1 2 NWS Honolulu (August 7, 2023). "Red Flag Warning". Iowa Environmental Mesonet. Iowa State University. Archived from the original on August 10, 2023. Retrieved August 10, 2023.
- ↑ "SPC Convective Outlook May 22, 1987". Iowa Environmental Mesonet. Retrieved December 27, 2022.
- ↑ Storm Prediction Center November 6, 2005 0100 UTC Day 1 Convective Outlook
- ↑ Storm Prediction Center March 3, 2020 0100 UTC Day 1 Convective Outlook
- ↑ Storm Prediction Center February 2, 2007 0100 UTC Day 1 Convective Outlook
- ↑ Storm Prediction Center December 11, 2021 1200 UTC Day 1 Convective Outlook
- ↑ Storm Prediction Center February 6, 2008 1200 UTC Day 1 Convective Outlook
- ↑ Storm Prediction Center December 31, 2010 2000 UTC Day 1 Convective Outlook
- ↑ Storm Prediction Center April 20, 2004 2000 UTC Day 1 Convective Outlook
- ↑ Storm Prediction Center November 16, 2006 1200 UTC Day 1 Convective Outlook
- ↑ Storm Prediction Center March 15, 1984 1918 UTC Day 1 Convective Outlook
- ↑ Storm Prediction Center March 3, 2019 2000 UTC Day 1 Convective Outlook
- ↑ Storm Prediction Center December 26, 2015 2000 UTC Day 1 Convective Outlook
- ↑ Storm Prediction Center April 13, 2020 1200 UTC Day 1 Convective Outlook
- ↑ Storm Prediction Center January 12, 2023 2000 UTC Day 1 Convective Outlook
- ↑ Storm Prediction Center March 5, 2022 2000 UTC Day 1 Convective Outlook
- ↑ Storm Prediction Center December 9, 2023 2000 UTC Day 1 Convective Outlook
- ↑ Storm Prediction Center January 11, 2020 1200 UTC Day 1 Convective Outlook
- ↑ Storm Prediction Center April 22, 2020 2000 UTC Day 1 Convective Outlook
- ↑ Storm Prediction Center December 23, 2014 2000 UTC Day 1 Convective Outlook
- ↑ Storm Prediction Center April 5, 2023 1200 UTC Day 1 Convective Outlook
- ↑ "SPC Convective Outlook May 31, 1985". Iowa Environmental Mesonet. Retrieved December 27, 2022.
- ↑ "SPC Convective Outlook February 22, 1998". Iowa Environmental Mesonet. Retrieved December 27, 2022.
- ↑ "SPC Convective Outlook August 28, 1990". Iowa Environmental Mesonet. Retrieved December 27, 2022.
- ↑ "SPC Convective Outlook May 27, 1997". Iowa Environmental Mesonet. Retrieved December 27, 2022.
- ↑ "SPC Convective Outlook March 1, 1997". Iowa Environmental Mesonet. Retrieved December 27, 2022.
- ↑ Storm Prediction Center April 2, 2006 2000 UTC Day 1 Convective Outlook
- ↑ Storm Prediction Center May 20, 2013 2000 UTC Day 1 Convective Outlook
- ↑ Storm Prediction Center April 12, 2020 1630 UTC Day 1 Convective Outlook
- ↑ Storm Prediction Center March 24, 2023 1630 UTC Day 1 Convective Outlook
- ↑ Storm Prediction Center April 27, 2011 2000 UTC Day 1 Convective Outlook
- ↑ "SPC Convective Outlook March 28, 1984". Iowa Environmental Mesonet. Retrieved December 27, 2022.
- ↑ Storm Prediction Center February 5, 2008 2000 UTC Day 1 Convective Outlook
- ↑ "SPC Convective Outlook May 3, 1999". Iowa Environmental Mesonet. Retrieved December 27, 2022.
- ↑ Storm Prediction Center March 2, 2012 2000 UTC Day 1 Convective Outlook
- ↑ "SPC Convective Outlook March 27, 1994". Iowa Environmental Mesonet. Retrieved December 27, 2022.
- ↑ Storm Prediction Center May 4, 2003 2000 UTC Day 1 Convective Outlook
- ↑ "SPC Convective Outlook April 8, 1998". Iowa Environmental Mesonet. Retrieved December 27, 2022.
- ↑ "SPC Convective Outlook November 10, 2002". Iowa Environmental Mesonet. Retrieved December 27, 2022.
- ↑ "Notable Weather Events of 2022". National Weather Service. Retrieved January 3, 2023.
- ↑ Weiss, Steven; Wilson, Larry; Edwards, Roger (December 22, 2020). "In Memoriam: Robert H. Johns 1942 – 2020". National Weather Association. Retrieved January 3, 2023.
- ↑ Storm Prediction Center June 30, 2013 0815 UTC Day 1 Fire Weather Outlook
- ↑ Storm Prediction Center September 9, 2020 1658 UTC Day 1 Fire Weather Outlook
- ↑ Storm Prediction Center October 9, 2017 0621 UTC Day 1 Fire Weather Outlook
- ↑ Storm Prediction Center October 25, 2003 0941 UTC Day 1 Fire Weather Outlook
- ↑ Storm Prediction Center November 8, 2018 1200 UTC Day 1 Fire Weather Outlook
- ↑ Storm Prediction Center March 12, 2006 0950 UTC Day 1 Fire Weather Outlook
- ↑ Mass, Clifford; Ovens, David; Conrick, Robert; Saltenberger, John (2021). "The September 2020 Wildfires over the Pacific Northwest". Weather and Forecasting. American Meteorological Society. 36 (5): 1843–1865. Bibcode:2021WtFor..36.1843M. doi:10.1175/WAF-D-21-0028.1. S2CID 238699028. Retrieved January 1, 2023.
- ↑ Storm Prediction Center September 8, 2020 1200 UTC Day 1 Fire Weather Outlook
- ↑ Storm Prediction Center March 6, 2017 0558 UTC Day 1 Fire Weather Outlook
- ↑ Storm Prediction Center April 9, 2009 0856 UTC Day 1 Fire Weather Outlook