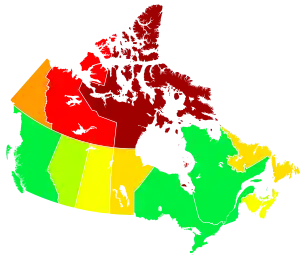
Life expectancy in Canada in 2018-2020, 3-year average.[lower-alpha 1] The legend is identical to the one given in the health region map below.

Life expectancy in Canada in 2015-2017, 3-year average, by health regions.[lower-alpha 1]

Development of life expectancy in Canada according to estimation of the World Bank Group

Life expectancy with calculated gender gap

Life expectancy in Canada according to estimation of the Our World in Data

Life expectancy in Canada and the US

Development of life expectancy in Canada in comparison to other big countries of North America
.png.webp)
Life Expectancy in Canada 1921-2018 [1]

Life expectancy and healthy life expectancy in Canada on the background of other countries of the world in 2019

Life expectancy and healthy life expectancy for males and females
This is a list of Canadian provinces and territories by life expectancy. Life expectancy is the average number of years of age that a group of infants born in the same year can expect to live, if maintained, from birth. The source is from the Canadian Vital Statistics Death Database.[2]
Life expectancy has increased in most Canadian provinces and territories due to medical advances in treating diseases such as heart disease and cancer - leading causes of death elsewhere worldwide. There were high gains in life expectancy in Nunavut due to improved rural health care; however, there were notable decreases in life expectancy in Newfoundland and Labrador.
Life expectancy in 2020 at birth
| Rank | Province/Territory | Life expectancy
(2020)[3] |
3-year average (2018-2020)[4][5][lower-alpha 1] | 3-year average (2008-2010)[4][5] | Change | ||
|---|---|---|---|---|---|---|---|
| All | Male | Female | |||||
| 1. | 82.34 | 82.57 | 80.77 | 84.31 | 81.24 | ||
| 2. | 82.19 | 82.39 | 79.93 | 84.93 | 81.82 | ||
| 3. | 82.14 | 82.34 | 80.16 | 84.47 | 81.53 | ||
| - | 81.72 | 81.97 | 79.82 | 84.11 | 81.15 | ||
| 4. | — | 81.80 | 79.80 | 83.72 | 80.44 | ||
| 5. | 80.89 | 81.46 | 79.15 | 83.85 | 80.81 | ||
| 6. | 81.17 | 80.84 | 78.70 | 82.91 | 80.34 | ||
| 7. | 80.58 | 80.46 | 78.37 | 82.55 | 80.17 | ||
| 8. | 79.46 | 80.06 | 77.69 | 82.56 | 79.51 | ||
| 9. | 79.66 | 79.89 | 77.93 | 81.87 | 79.28 | ||
| 10. | 79.41 | 79.88 | 77.73 | 82.12 | 79.64 | ||
| 11. | — | 78.68 | 75.92 | 81.47 | 77.25 | ||
| 12. | — | 77.00 | 75.10 | 78.88 | 76.77 | ||
| 13. | — | 70.74 | 68.18 | 72.69 | 71.53 | ||
Past life expectancy
| Province/Territory | 2019[6] | 2010[6] | 2000[6] | 1990[6] | 1980[6] | Change 1980-2019 |
|---|---|---|---|---|---|---|
| 82.1 | 81.2 | 79.0 | 77.6 | 75.5 | ||
| 81.6 | 81.3 | 79.4 | 77.8 | 75.0 | ||
| 82.4 | 82.1 | 80.3 | 78.1 | 76.0 | ||
| 80.1 | 79.9 | 78.0 | 77.4 | 75.3 | ||
| 80.7 | 80.7 | 78.9 | 77.3 | 74.5 | ||
| 80.0 | 79.6 | 77.3 | 76.1 | 74.8 | ||
| 77.4 | 77.8 | 75.5 | 72.4 | 68.7 | ||
| 80.4 | 80.3 | 78.5 | 76.7 | 74.6 | ||
| 71.1 | 70.4 | 67.5 | 65.5 | 62.4 | ||
| 82.4 | 81.7 | 79.4 | 77.8 | 75.4 | ||
| 81.6 | 81.3 | 78.4 | 76.9 | 76.2 | ||
| 82.9 | 81.4 | 79.0 | 77.0 | 74.4 | ||
| 80.3 | 79.6 | 78.5 | 77.9 | 75.9 | ||
| 79.0 | 77.3 | 75.0 | 74.4 | 69.8 |
Life expectancy by health region, 2015-2017 3-year averages
| Health Region | Province | Life Expectancy[7] | Male[7] | Female[7] |
|---|---|---|---|---|
| Eastern | 79.7 | 77.6 | 81.8 | |
| Central | 79.5 | 77.7 | 81.3 | |
| Western | 79.5 | 78 | 80.8 | |
| Labrador-Grenfell | 77.9 | 75.7 | 80.3 | |
| Prince Edward Island | 82.0 | 79.9 | 83.8 | |
| Western | 80.9 | 78.6 | 83.1 | |
| Northern | 79.5 | 77.6 | 81.5 | |
| Eastern | 78.5 | 75.6 | 81.4 | |
| Central | 81.2 | 79.2 | 83.1 | |
| Moncton | 81.7 | 79.4 | 84 | |
| Saint John | 80.1 | 78 | 82.1 | |
| Fredericton | 80.9 | 79.1 | 82.6 | |
| Edmundston | 79.8 | 77.5 | 81.8 | |
| Campbellton | 79.4 | 76.5 | 82 | |
| Bathurst | 81.4 | 79.2 | 83.6 | |
| Miramichi | 79.5 | 76.2 | 82.6 | |
| Bas-Saint-Laurent | 82.2 | 80.1 | 84 | |
| Saguenay - Lac-Saint-Jean | 82.5 | 80.9 | 84 | |
| Capitale-Nationale | 83.3 | 81.4 | 84.9 | |
| Mauricie et du Centre-du-Québec | 82.3 | 80.1 | 84.3 | |
| Estrie | 83.1 | 81.1 | 84.9 | |
| Montréal | 83.1 | 81 | 85.1 | |
| Outaouais | 81.5 | 79.7 | 83.2 | |
| Abitibi-Témiscamingue | 80.4 | 78.5 | 82.3 | |
| Côte-Nord | 81.1 | 79.8 | 82.4 | |
| Nord-du-Québec | 80.6 | 79.3 | 81.4 | |
| Gaspésie - Îles-de-la-Madeleine | 80.8 | 78.7 | 82.8 | |
| Chaudière-Appalaches | 83.3 | 81.4 | 85.1 | |
| Laval | 83.9 | 81.9 | 85.6 | |
| Lanaudière | 82.1 | 80.6 | 83.6 | |
| Laurentides | 82.1 | 80.5 | 83.7 | |
| Montérégie | 82.8 | 81 | 84.4 | |
| Nunavik | 68.7 | 65.6 | 73 | |
| Terres-Cries-de-la-Baie-James | 77.2 | 75.4 | 78.7 | |
| Algoma | 79.4 | 77.2 | 81.6 | |
| Brant | 80.2 | 78.1 | 82.2 | |
| Durham | 82.5 | 80.6 | 84.4 | |
| Grey Bruce | 81.6 | 79.5 | 83.8 | |
| Haldimand-Norfolk | 80.2 | 78.3 | 82.1 | |
| Haliburton, Kawartha, Pine Ridge | 81.2 | 79.3 | 83.2 | |
| Halton | 84.5 | 82.6 | 86.2 | |
| Hamilton | 81.3 | 78.8 | 83.6 | |
| Hastings and Prince Edward | 80.1 | 77.8 | 82.4 | |
| Huron | 80.7 | 78.5 | 82.7 | |
| Chatham-Kent | 80.4 | 78.1 | 82.4 | |
| Kingston, Frontenac and Lennox and Addington | 81.5 | 79.1 | 83.8 | |
| Lambton | 80.5 | 78.3 | 82.7 | |
| Leeds, Grenville and Lanark | 81.3 | 79.4 | 83 | |
| Middlesex-London | 82.0 | 79.9 | 84 | |
| Niagara | 81.4 | 79.2 | 83.5 | |
| North Bay Parry Sound | 80.3 | 78.2 | 82.4 | |
| Northwestern | 76.6 | 74.7 | 78.6 | |
| Ottawa | 83.7 | 81.9 | 85.3 | |
| Oxford Elgin St. Thomas | 80.8 | 78.9 | 82.6 | |
| Peel | 84.8 | 83 | 86.4 | |
| Perth | 81.7 | 79.7 | 83.5 | |
| Peterborough | 81.5 | 79.3 | 83.5 | |
| Porcupine | 78.3 | 76.1 | 80.5 | |
| Renfrew | 81.1 | 79.2 | 83 | |
| Eastern | 81.2 | 79.1 | 83.2 | |
| Simcoe Muskoka | 81.6 | 79.7 | 83.4 | |
| Sudbury | 79.8 | 76.9 | 82.7 | |
| Thunder Bay | 78.9 | 76.8 | 81.1 | |
| Timiskaming | 79.3 | 76.9 | 81.7 | |
| Waterloo | 82.1 | 80.2 | 83.9 | |
| Wellington-Dufferin-Guelph | 82.3 | 80.5 | 83.9 | |
| Windsor-Essex | 81.7 | 79.7 | 83.7 | |
| York | 85.7 | 84 | 87.1 | |
| Toronto | 84.3 | 81.7 | 86.7 | |
| Winnipeg | 80.8 | 78.6 | 82.8 | |
| Prairie Mountain | 80.0 | 78 | 82.1 | |
| Interlake-Eastern | 80.3 | 78.6 | 82.2 | |
| Northern | 72.7 | 70.3 | 75.2 | |
| Southern | 81.0 | 79.1 | 83.1 | |
| Sun Country | 81.5 | 79.7 | 83.2 | |
| Five Hills | 81.3 | 78.4 | 84 | |
| Cypress | 81.4 | 79.3 | 83.5 | |
| Regina Qu'Appelle | 80.5 | 78.2 | 82.8 | |
| Sunrise | 79.5 | 76.7 | 82.4 | |
| Saskatoon | 81.3 | 79.1 | 83.4 | |
| Heartland | 80.9 | 78.2 | 83.7 | |
| Kelsey Trail | 78.8 | 76.4 | 81.4 | |
| Prince Albert Parkland | 78.3 | 75.4 | 81.6 | |
| Prairie North | 78.8 | 76.1 | 81.7 | |
| Mamawetan/Keewatin/Athabasca | 73.3 | 71 | 75.8 | |
| South | 80.3 | 78.1 | 82.4 | |
| Calgary | 83.1 | 81.2 | 85 | |
| Central | 79.9 | 77.4 | 82.6 | |
| Edmonton | 82 | 79.5 | 84.5 | |
| North | 79.2 | 77.1 | 81.7 | |
| East Kootenay | 80.5 | 78.5 | 82.7 | |
| Kootenay-Boundary | 80.4 | 77.9 | 82.8 | |
| Okanagan | 81.2 | 78.7 | 83.8 | |
| Thompson/Cariboo | 79.9 | 77.8 | 82.3 | |
| Fraser East | 81.2 | 78.7 | 83.7 | |
| Fraser North | 83.6 | 81.6 | 85.6 | |
| Fraser South | 82.8 | 80.6 | 85 | |
| Richmond | 86.8 | 85.2 | 88.2 | |
| Vancouver | 84.1 | 81.6 | 86.6 | |
| North Shore/Coast Garibaldi | 83.9 | 81.6 | 86.2 | |
| South Vancouver Island | 83.3 | 81.1 | 85.3 | |
| Central Vancouver Island | 81.3 | 79.2 | 83.3 | |
| North Vancouver Island | 81 | 78.6 | 83.5 | |
| Northwest | 79.1 | 76.9 | 81.7 | |
| Northern Interior | 78.8 | 76.9 | 81 | |
| Northeast | 78 | 76.4 | 79.6 | |
| Yukon[lower-alpha 1] | 78.7 | 75.9 | 81.5 | |
| Northwest Territories | 77.1 | 75.2 | 79.3 | |
| Nunavut | 72.1 | 70.8 | 73.4 |
See also
Wikimedia Commons has media related to Life expectancy charts for Canada.
- List of North American countries by life expectancy
- List of Canadian provinces and territories by GDP
- List of Canadian provinces and territories by Human Development Index
- List of governments in Canada by annual expenditures
- List of Canadian provincial and territorial name etymologies
- Population of Canada by province and territory
Notes
References
- ↑ "Statistics Canada".
- ↑ "Life Expectancy in Canada".
- ↑ "Life expectancy and other elements of the complete life table, single-year estimates, Canada, all provinces except Prince Edward Island". Statistics Canada. 2022-01-24. Retrieved 2023-01-09.
- 1 2 "Life expectancy and other elements of the complete life table, three-year estimates, Canada, all provinces except Prince Edward Island". Statistics Canada. 2022-01-24. Retrieved 2023-01-09.
- 1 2 "Life expectancy and other elements of the abridged life table, three-year estimates, Prince Edward Island and the territories". Statistics Canada. 2022-01-24. Retrieved 2023-01-09.
- 1 2 3 4 5 "Canadian male and Female Life Expectancy By Province".
- 1 2 3 "Life Expectancy by health region".
This article is issued from Wikipedia. The text is licensed under Creative Commons - Attribution - Sharealike. Additional terms may apply for the media files.