| |||||||||||||||||||||||||
All 9 Indiana seats to the United States House of Representatives | |||||||||||||||||||||||||
|---|---|---|---|---|---|---|---|---|---|---|---|---|---|---|---|---|---|---|---|---|---|---|---|---|---|
| |||||||||||||||||||||||||
| |||||||||||||||||||||||||
| Elections in Indiana |
|---|
 |
The 2014 U.S. House of Representatives elections in Indiana was held on Tuesday, November 4, 2014 to elect 9 members of the U.S. House of Representatives from Indiana. The Members elected at this election will serve in the 114th Congress. Indiana has placed Republican and Democratic nominees on the ballot in a nation-best 189 consecutive U.S. House races across each of the last 19 election cycles since 1978.[1]
Overview
| United States House of Representatives elections in Indiana, 2014[2] | |||||
|---|---|---|---|---|---|
| Party | Votes | Percentage | Seats | +/– | |
| Republican | 788,762 | 58.78% | 7 | - | |
| Democratic | 502,104 | 37.42% | 2 | - | |
| Libertarian | 50,948 | 3.80% | 0 | - | |
| Totals | 1,341,814 | 100.00% | 9 | - | |
By district
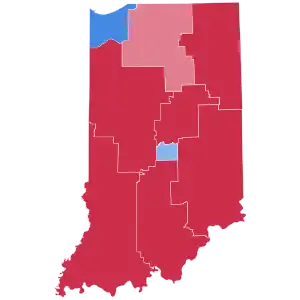
Results of the 2014 United States House of Representatives elections in Indiana by district:[3]
| District | Republican | Democratic | Others | Total | Result | ||||
|---|---|---|---|---|---|---|---|---|---|
| Votes | % | Votes | % | Votes | % | Votes | % | ||
| District 1 | 51,000 | 35.84% | 86,579 | 60.85% | 4,714 | 3.31% | 142,293 | 100.0% | Democratic hold |
| District 2 | 85,583 | 58.94% | 55,590 | 38.29% | 4,027 | 2.77% | 145,200 | 100.0% | Republican hold |
| District 3 | 97,892 | 65.79% | 39,771 | 26.73% | 11,130 | 7.48% | 148,793 | 100.0% | Republican hold |
| District 4 | 94,998 | 66.87% | 47,056 | 33.13% | 0 | 0.00% | 142,054 | 100.0% | Republican hold |
| District 5 | 105,277 | 65.21% | 49,756 | 30.82% | 6,407 | 3.97% | 161,440 | 100.0% | Republican hold |
| District 6 | 102,187 | 65.90% | 45,509 | 29.35% | 7,375 | 4.76% | 155,071 | 100.0% | Republican hold |
| District 7 | 46,887 | 41.77% | 61,443 | 54.73% | 3,931 | 3.50% | 112,261 | 100.0% | Democratic hold |
| District 8 | 103,344 | 60.32% | 61,384 | 35.83% | 6,587 | 3.85% | 171,315 | 100.0% | Republican hold |
| District 9 | 101,594 | 62.17% | 55,016 | 33.67% | 6,777 | 4.15% | 163,387 | 100.0% | Republican hold |
| Total | 788,762 | 58.78% | 502,104 | 37.42% | 50,948 | 3.80% | 1,341,814 | 100.0% | |
District 1
| |||||||||||||||||
 County Results Visclosky: 50-60% 60-70% | |||||||||||||||||
| |||||||||||||||||


Incumbent Democrat Pete Visclosky, who had represented the 1st district since 1985, ran for re-election.
Democratic primary
Candidates
Nominee
- Pete Visclosky, incumbent U.S. Representative
Primary results
| Party | Candidate | Votes | % | |
|---|---|---|---|---|
| Democratic | Pete Visclosky (incumbent) | 34,446 | 100.0 | |
Republican primary
Candidates
Nominee
- Mark Leyva, activist and nominee for this seat in 2010
Primary results
| Party | Candidate | Votes | % | |
|---|---|---|---|---|
| Republican | Mark Leyva | 12,738 | 100.0 | |
General election
Results
| Party | Candidate | Votes | % | |
|---|---|---|---|---|
| Democratic | Pete Visclosky (incumbent) | 86,579 | 60.9 | |
| Republican | Mark Leyva | 51,000 | 35.8 | |
| Libertarian | Donna Dunn | 4,714 | 3.3 | |
| Total votes | 142,293 | 100.0 | ||
| Democratic hold | ||||
District 2
Incumbent Republican Jackie Walorski, who had represented the 2nd district since 2013, ran for re-election.
Republican primary
Candidates
Nominee
- Jackie Walorski, incumbent U.S. Representative
Primary results
| Party | Candidate | Votes | % | |
|---|---|---|---|---|
| Republican | Jackie Walorski (incumbent) | 28,641 | 100.0 | |
Democratic primary
Candidates
Nominee
- Joe Bock, University of Notre Dame administrator[6]
Eliminated in primary
Declined
Primary results
| Party | Candidate | Votes | % | |
|---|---|---|---|---|
| Democratic | Joe Bock | 11,103 | 58.1 | |
| Democratic | Dan Morrison | 3,540 | 18.5 | |
| Democratic | Bob Kern | 2,634 | 13.8 | |
| Democratic | Douglas M. Carpenter | 1,837 | 9.6 | |
| Total votes | 19,114 | 100.0 | ||
General election
Endorsements
- Organizations
- Democratic Congressional Campaign Committee "Emerging Races" Program[10]
Predictions
| Source | Ranking | As of |
|---|---|---|
| The Cook Political Report[11] | Safe R | November 3, 2014 |
| Rothenberg[12] | Safe R | October 24, 2014 |
| Sabato's Crystal Ball[13] | Likely R | October 30, 2014 |
| RCP | Likely R | November 2, 2014 |
| Daily Kos Elections[14] | Safe R | November 4, 2014 |
Results
| Party | Candidate | Votes | % | |
|---|---|---|---|---|
| Republican | Jackie Walorski (incumbent) | 85,583 | 58.9 | |
| Democratic | Joe Bock | 55,590 | 38.3 | |
| Libertarian | Jeff Petermann | 4,027 | 2.8 | |
| Total votes | 145,200 | 100.0 | ||
| Republican hold | ||||
District 3
Incumbent Republican Marlin Stutzman, who had represented the 3rd district since 2010, ran for re-election.
Republican primary
Candidates
Nominee
- Marlin Stutzman, incumbent U.S. Representative
Eliminated in primary
- Mark Baringer
- James Mahoney, former delegate to the Republican State Convention
Primary results
| Party | Candidate | Votes | % | |
|---|---|---|---|---|
| Republican | Marlin Stutzman (incumbent) | 48,837 | 81.7 | |
| Republican | Mark William Baringer | 5,868 | 9.8 | |
| Republican | James E. Mahoney III | 5,094 | 8.5 | |
| Total votes | 59,799 | 100.0 | ||
Democratic primary
Candidates
Nominee
- Justin Kuhnle, family case manager and candidate for this seat in 2012
Eliminated in primary
- Jim Redmond
- Tommy Schrader, candidate for this seat in 2012
Primary results
| Party | Candidate | Votes | % | |
|---|---|---|---|---|
| Democratic | Justin Kuhnle | 2,893 | 34.9 | |
| Democratic | Tommy A. Schrader | 2,805 | 33.8 | |
| Democratic | Jim Redmond | 2,597 | 31.3 | |
| Total votes | 8,295 | 100.0 | ||
General election
Results
| Party | Candidate | Votes | % | |
|---|---|---|---|---|
| Republican | Marlin Stutzman (incumbent) | 102,889 | 69.2 | |
| Democratic | Justin Kuhnle | 39,771 | 26.7 | |
| Libertarian | Scott Wise | 6,113 | 4.1 | |
| Total votes | 148,773 | 100.0 | ||
| Republican hold | ||||
District 4
Incumbent Republican Todd Rokita, who had represented the 4th district since 2011, ran for re-election.
Republican primary
Candidates
Nominee
- Todd Rokita, incumbent U.S. Representative
Eliminated in primary
- Kevin Grant, Army National Guard member
Primary results
| Party | Candidate | Votes | % | |
|---|---|---|---|---|
| Republican | Todd Rokita (incumbent) | 43,179 | 71.2 | |
| Republican | Kevin J. Grant | 17,472 | 28.8 | |
| Total votes | 60,651 | 100.0 | ||
Democratic primary
Candidates
Nominee
- John Dale, teacher
Eliminated in primary
- Jeffrey Blaydes
- Roger Day
- John Futrell
- Howard Pollchi
Primary results
| Party | Candidate | Votes | % | |
|---|---|---|---|---|
| Democratic | John Dale | 3,742 | 42.2 | |
| Democratic | Roger D. Day | 2,266 | 25.5 | |
| Democratic | Jeffrey Oliver Blaydes | 1,332 | 15.0 | |
| Democratic | Howard Joseph Pollchik | 778 | 8.8 | |
| Democratic | John L. Futrell | 754 | 8.5 | |
| Total votes | 8,872 | 100.0 | ||
General election
Results
| Party | Candidate | Votes | % | |
|---|---|---|---|---|
| Republican | Todd Rokita (Incumbent) | 94,998 | 66.9 | |
| Democratic | John Dale | 47,056 | 33.1 | |
| Total votes | 142,054 | 100.0 | ||
| Republican hold | ||||
District 5
Incumbent Republican Susan Brooks, who had represented the 5th district since 2013, ran for re-election.
Republican primary
Candidates
Nominee
- Susan Brooks, incumbent U.S. Representative
Eliminated in primary
- David Campbell
- David Stockdale, independent insurance broker
Primary results
| Party | Candidate | Votes | % | |
|---|---|---|---|---|
| Republican | Susan Brooks (incumbent) | 34,996 | 72.7 | |
| Republican | David S. Stockdale | 7,327 | 15.2 | |
| Republican | David M. Campbell | 5,790 | 12.1 | |
| Total votes | 48,113 | 100.0 | ||
Democratic primary
Candidates
Nominee
- Shawn Denney, teacher
Eliminated in primary
- Allen Davidson, engineer
- David Ford, U.S. Air Force Battlefield weather forecaster
Primary results
| Party | Candidate | Votes | % | |
|---|---|---|---|---|
| Democratic | Shawn A. Denney | 6,141 | 41.9 | |
| Democratic | David William Ford | 4,856 | 33.1 | |
| Democratic | Allen Ray Davidson | 3,660 | 25.0 | |
| Total votes | 14,657 | 100.0 | ||
General election
Results
| Party | Candidate | Votes | % | |
|---|---|---|---|---|
| Republican | Susan Brooks (incumbent) | 105,277 | 65.2 | |
| Democratic | Shawn Denney | 49,756 | 30.8 | |
| Libertarian | John Krom | 6,407 | 4.0 | |
| Total votes | 161,440 | 100.0 | ||
| Republican hold | ||||
District 6
Incumbent Republican Luke Messer, who had represented the 6th district since 2013, ran for re-election.
Republican primary
Candidates
Nominee
- Luke Messer, incumbent U.S. Representative
Primary results
| Party | Candidate | Votes | % | |
|---|---|---|---|---|
| Republican | Luke Messer (incumbent) | 49,094 | 100.0 | |
Democratic primary
Candidates
Nominee
- Susan Heitzman, small business owner and candidate for this seat in 2012
Eliminated in primary
- Lane Siekman, attorney
- Corrine Westerfield
Primary results
| Party | Candidate | Votes | % | |
|---|---|---|---|---|
| Democratic | Susan Hall Heitzman | 9,078 | 48.3 | |
| Democratic | Lane Siekman | 5,574 | 29.6 | |
| Democratic | Corrine Nicole Westerfield | 4,151 | 22.1 | |
| Total votes | 18,803 | 100.0 | ||
General election
Results
| Party | Candidate | Votes | % | |
|---|---|---|---|---|
| Republican | Luke Messer (incumbent) | 102,187 | 65.9 | |
| Democratic | Susan Hall Heitzman | 45,509 | 29.4 | |
| Libertarian | Eric Miller | 7,375 | 4.7 | |
| Total votes | 155,071 | 100.0 | ||
| Republican hold | ||||
District 7
Incumbent Democrat André Carson, who had represented the 7th district since 2008, ran for re-election.
Democratic primary
Candidates
Nominee
- André Carson, incumbent U.S. Representative
Eliminated in primary
- Mmoja Ajabu
- Curtis Godfrey
- Pierre Pullins
Primary results
| Party | Candidate | Votes | % | |
|---|---|---|---|---|
| Democratic | André Carson (incumbent) | 19,446 | 89.1 | |
| Democratic | Curtis Godfrey | 1,209 | 5.5 | |
| Democratic | Mmoja Ajabu | 782 | 3.6 | |
| Democratic | Pierre Quincy Pullins | 390 | 1.8 | |
| Total votes | 21,827 | 100.0 | ||
Republican primary
Candidates
Nominee
- Catherine Ping, Army Reserve Lieutenant Colonel, business owner and candidate for this seat in 2012
Eliminated in primary
- Wayne Harmon, parole agent
- J.D. Miniear, christian ministry outreach and candidate for this seat in 2012
- Erin Magee
- Gordon Smith, Indiana Army National Guard Coordinator
Primary results
| Party | Candidate | Votes | % | |
|---|---|---|---|---|
| Republican | Catherine Ping | 4,882 | 35.1 | |
| Republican | Wayne "Gunny" Harmon | 3,258 | 23.4 | |
| Republican | J.D. Miniear | 2,840 | 20.4 | |
| Republican | Gordon Smith | 1,872 | 13.5 | |
| Republican | Erin Kent Magee | 1,057 | 7.6 | |
| Total votes | 13,909 | 100.0 | ||
General election
Results
| Party | Candidate | Votes | % | |
|---|---|---|---|---|
| Democratic | Andre Carson (incumbent) | 61,443 | 54.7 | |
| Republican | Catherine Ping | 46,887 | 41.8 | |
| Libertarian | Chris Mayo | 3,931 | 3.5 | |
| Total votes | 112,261 | 100.0 | ||
| Democratic hold | ||||
District 8
Incumbent Republican Larry Bucshon, who had represented the 8th district since 2011, ran for re-election.
Republican primary
Candidates
Nominee
- Larry Bucshon, incumbent U.S. Representative
Eliminated in primary
- Andrew McNeil
Primary results
| Party | Candidate | Votes | % | |
|---|---|---|---|---|
| Republican | Larry Bucshon (incumbent) | 30,967 | 74.8 | |
| Republican | Andrew T. McNeil | 10,405 | 25.2 | |
| Total votes | 41,372 | 100.0 | ||
Democratic primary
Candidates
Nominee
- Tom Spangler
Declined
- Dave Crooks, former state representative and nominee for this seat in 2012
Primary results
| Party | Candidate | Votes | % | |
|---|---|---|---|---|
| Democratic | Tom Spangler | 23,055 | 100.0 | |
General election
Results
| Party | Candidate | Votes | % | |
|---|---|---|---|---|
| Republican | Larry Bucshon (incumbent) | 103,344 | 60.3 | |
| Democratic | Tom Spangler | 61,384 | 35.8 | |
| Libertarian | Andrew Horning | 6,587 | 3.9 | |
| Total votes | 171,315 | 100.0 | ||
| Republican hold | ||||
District 9
Incumbent Republican Todd Young, who had represented the 9th district since 2011, ran for re-election.
Republican primary
Candidates
Nominee
- Todd Young, incumbent U.S. Representative
Eliminated in primary
- Kathy Heil
- Mark Jones
Primary results
| Party | Candidate | Votes | % | |
|---|---|---|---|---|
| Republican | Todd Young (incumbent) | 30,402 | 79.4 | |
| Republican | Kathy Lowe Heil | 4,607 | 12.0 | |
| Republican | Mark G. Jones | 3,293 | 8.6 | |
| Total votes | 38,302 | 100.0 | ||
Democratic primary
Candidates
Nominee
- Bill Bailey, former state representative and former mayor of Seymour[15]
Eliminated in primary
- James McClure, Jr.
- J.S. Miller
- William Thomas
Declined
- Shelli Yoder, Monroe County Council member and nominee for this seat in 2012
Primary results
| Party | Candidate | Votes | % | |
|---|---|---|---|---|
| Democratic | Bill Bailey | 10,392 | 45.4 | |
| Democratic | James R. McClure, Jr. | 5,733 | 25.0 | |
| Democratic | J.S. Miller | 3,559 | 15.6 | |
| Democratic | William Joseph Thomas | 3,206 | 14.0 | |
| Total votes | 22,890 | 100.0 | ||
General election
Results
| Party | Candidate | Votes | % | |
|---|---|---|---|---|
| Republican | Todd Young (incumbent) | 101,594 | 62.2 | |
| Democratic | Bill Bailey | 55,016 | 33.7 | |
| Libertarian | Ralph Mike Frey | 5,777 | 4.1 | |
| Total votes | 162,387 | 100.0 | ||
| Republican hold | ||||
See also
References
- ↑ Ostermeier, Eric (September 30, 2014). "No Free Passes: States With 2 Major Party Candidates in Every US House Race". Smart Politics.
- ↑ "Election Statistics, 1920 to Present - US House of Representatives: History, Art & Archives". history.house.gov. Retrieved April 18, 2018.
- ↑ Haas, Karen L. (March 9, 2015). "Statistics of the Congressional Election of November 4, 2014". Clerk of the U.S. House of Representatives. Retrieved October 28, 2019.
- 1 2 3 4 5 6 7 8 9 10 11 12 13 14 15 16 17 18 "Secretary of State : Election Division: Election Results". Retrieved December 17, 2014.
- 1 2 3 4 5 6 7 8 9 "Secretary of State : Election Division: Election Results". Retrieved December 18, 2014.
- ↑ AP (October 20, 2013). "Notre Dame official weighs 2nd District run". Lexington Herald-Leader. Retrieved October 21, 2013.
- ↑ Erin Blasko (April 18, 2014). "2nd District candidate runs as social liberal". southbendtribune.com. South Bend Tribune. Archived from the original on August 9, 2023. Retrieved August 9, 2023.
- ↑ Livingson, Abby (June 19, 2013). "Ambitious Hoosiers Wait for Future Statewide Races". Roll Call. Retrieved August 14, 2013.
- ↑ "Brendan Mullen Not Running for Indiana's 2nd #IN02 (Updated) | At the Races". Atr.rollcall.com. July 12, 2013. Retrieved August 12, 2014.
- ↑ "DCCC Chairman Israel Announces First 35 Districts In Red To Blue Program, Historic High For Women". dccc.org. DCCC. March 3, 2014. Archived from the original on June 11, 2014. Retrieved February 16, 2023.
- ↑ "2014 House Race Ratings for November 3, 2014". House: Race Ratings. Cook Political Report. Retrieved November 3, 2014.
- ↑ "2014 House Ratings (October 24, 2014)". House Ratings. The Rothenberg Political Report. Retrieved October 24, 2014.
- ↑ "2014 House". Sabato's Crystal Ball. April 10, 2014. Retrieved April 11, 2014.
- ↑ "Daily Kos Elections House race ratings: Initial ratings for 2014". Daily Kos Elections. Retrieved November 4, 2014.
- ↑ BRIAN A. HOWEY (September 30, 2013). "Former Seymour Mayor Bailey to challenge Rep. Young in 9th CD". howeypolitics.com. Archived from the original on October 4, 2013. Retrieved April 22, 2023.