| Demographics of Saint Vincent and the Grenadines | |
|---|---|
 Population pyramid of Saint Vincent and the Grenadines in 2020 | |
| Population | 100,969 (2022 est.) |
| Growth rate | -0.17% (2022 est.) |
| Birth rate | 12.27 births/1,000 population (2022 est.) |
| Death rate | 7.49 deaths/1,000 population (2022 est.) |
| Net migration rate | -6.47 migrant(s)/1,000 population (2022 est.) |
| Age structure | |
| 0–14 years | 20.15% |
| 65 and over | 10.72% |
| Nationality | |
| Major ethnic | African descent (71.2%) |
This is a demography of the population of Saint Vincent and the Grenadines including population density, ethnicity, religious affiliations and other aspects of the population.
| Year | Pop. | ±% p.a. |
|---|---|---|
| 1871 | 35,688 | — |
| 1881 | 40,548 | +1.28% |
| 1891 | 41,054 | +0.12% |
| 1911 | 41,877 | +0.10% |
| 1921 | 44,447 | +0.60% |
| 1931 | 47,961 | +0.76% |
| 1946 | 61,647 | +1.69% |
| 1960 | 79,948 | +1.87% |
| 1970 | 86,944 | +0.84% |
| 1980 | 97,845 | +1.19% |
| 1991 | 107,598 | +0.87% |
| 2001 | 109,022 | +0.13% |
| 2012 | 109,991 | +0.08% |
| 2023 | — | |
| Source:[1] Note: Pop. numbers for 2012, 2001, and 1991 represent total populations, while pop. numbers for previous years exclude institutional populations. | ||
Population
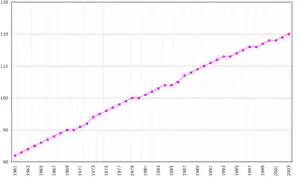
According to the 2012 census, Saint Vincent and the Grenadines had a total population of 109,991, an increase of 969 since the 2001 census.[1][2] While the country's population continues to increase, annual growth has slowed since the 1991 census.[1]
The estimated population for 2021 is 104,332 (per the 2022 revision of the World Population Prospects[3][4]).
Vital statistics
| Average population (x 1000) | Live births | Deaths | Natural change | Crude birth rate (per 1000) | Crude death rate (per 1000) | Natural change (per 1000) | Total fertility rate | Infant mortality rate | |
|---|---|---|---|---|---|---|---|---|---|
| 1950 | 67 | 2 662 | 1 022 | 1 640 | 39.7 | 15.3 | 24.5 | ||
| 1951 | 68 | 2 930 | 990 | 1 940 | 43.0 | 14.5 | 28.5 | ||
| 1952 | 69 | 2 906 | 1 117 | 1 789 | 42.0 | 16.1 | 25.8 | ||
| 1953 | 71 | 3 069 | 1 127 | 1 942 | 43.5 | 16.0 | 27.5 | ||
| 1954 | 72 | 3 117 | 1 125 | 1 992 | 43.3 | 15.6 | 27.7 | ||
| 1955 | 74 | 3 607 | 1 102 | 2 505 | 49.1 | 15.0 | 34.1 | ||
| 1956 | 75 | 3 601 | 937 | 2 664 | 48.0 | 12.5 | 35.5 | ||
| 1957 | 77 | 4 261 | 985 | 3 276 | 55.6 | 12.9 | 42.7 | ||
| 1958 | 78 | 3 930 | 1 223 | 2 707 | 50.3 | 15.6 | 34.6 | ||
| 1959 | 80 | 4 051 | 1 141 | 2 910 | 50.9 | 14.3 | 36.6 | ||
| 1960 | 81 | 3 985 | 1 210 | 2 775 | 49.2 | 14.9 | 34.3 | ||
| 1961 | 82 | 3 968 | 1 024 | 2 944 | 48.3 | 12.5 | 35.8 | ||
| 1962 | 83 | 3 727 | 957 | 2 770 | 44.8 | 11.5 | 33.3 | ||
| 1963 | 84 | 3 637 | 1 006 | 2 631 | 43.2 | 12.0 | 31.3 | ||
| 1964 | 85 | 3 678 | 821 | 2 857 | 43.2 | 9.7 | 33.6 | ||
| 1965 | 86 | 3 770 | 831 | 2 939 | 43.9 | 9.7 | 34.2 | ||
| 1966 | 87 | 3 809 | 829 | 2 980 | 43.9 | 9.5 | 34.3 | ||
| 1967 | 88 | 3 574 | 775 | 2 799 | 40.7 | 8.8 | 31.9 | ||
| 1968 | 89 | 3 324 | 825 | 2 499 | 37.5 | 9.3 | 28.2 | ||
| 1969 | 90 | 3 093 | 883 | 2 210 | 34.6 | 9.9 | 24.7 | ||
| 1970 | 90 | 3 327 | 737 | 2 590 | 36.8 | 8.1 | 28.6 | ||
| 1971 | 91 | 3 714 | 734 | 2 980 | 40.6 | 8.0 | 32.6 | ||
| 1972 | 92 | 3 705 | 890 | 2 815 | 40.1 | 9.6 | 30.4 | ||
| 1973 | 94 | 3 243 | 990 | 2 253 | 34.7 | 10.6 | 24.1 | ||
| 1974 | 95 | 3 373 | 716 | 2 657 | 35.7 | 7.6 | 28.1 | ||
| 1975 | 96 | 3 398 | 724 | 2 674 | 35.5 | 7.6 | 28.0 | ||
| 1976 | 97 | 3 786 | 724 | 3 062 | 39.2 | 7.5 | 31.7 | ||
| 1977 | 98 | 3 152 | 732 | 2 420 | 32.3 | 7.5 | 24.8 | ||
| 1978 | 99 | 3 275 | 745 | 2 530 | 33.2 | 7.6 | 25.7 | ||
| 1979 | 100 | 3 409 | 693 | 2 716 | 34.2 | 7.0 | 27.3 | ||
| 1980 | 101 | 3 075 | 724 | 2 351 | 30.6 | 7.2 | 23.4 | ||
| 1981 | 101 | 3 227 | 772 | 2 455 | 31.8 | 7.6 | 24.2 | ||
| 1982 | 102 | 3 352 | 717 | 2 635 | 32.8 | 7.0 | 25.8 | ||
| 1983 | 103 | 3 295 | 779 | 2 516 | 32.0 | 7.6 | 24.4 | ||
| 1984 | 104 | 2 831 | 703 | 2 128 | 27.3 | 6.8 | 20.5 | ||
| 1986 | 105 | 2 708 | 655 | 2 053 | 25.7 | 6.2 | 19.5 | ||
| 1988 | 107 | 2 537 | 712 | 1 825 | 23.8 | 6.7 | 17.1 | ||
| 1990 | 108 | 2 552 | 686 | 1 866 | 23.7 | 6.4 | 17.4 | ||
| 1991 | 108 | 2 591 | 654 | 1 937 | 24.0 | 6.1 | 18.0 | ||
| 1992 | 108 | 2 686 | 714 | 1 972 | 24.9 | 6.6 | 18.3 | ||
| 1993 | 108 | 2 687 | 680 | 2 007 | 24.9 | 6.3 | 18.6 | ||
| 1994 | 108 | 2 549 | 732 | 1 817 | 23.6 | 6.8 | 16.8 | ||
| 1995 | 108 | 2 614 | 730 | 1 884 | 24.2 | 6.8 | 17.4 | ||
| 1996 | 108 | 2 338 | 792 | 1 546 | 21.6 | 7.3 | 14.3 | ||
| 1997 | 108 | 2 311 | 736 | 1 575 | 21.4 | 6.8 | 14.6 | ||
| 1998 | 108 | 2 112 | 830 | 1 282 | 19.6 | 7.7 | 11.9 | ||
| 1999 | 108 | 2 171 | 833 | 1 338 | 20.1 | 7.7 | 12.4 | ||
| 2000 | 108 | 2 149 | 700 | 1 449 | 19.9 | 6.5 | 13.4 | ||
| 2001 | 108 | 2 109 | 765 | 1 344 | 19.5 | 7.1 | 12.4 | ||
| 2002 | 108 | 1 985 | 766 | 1 219 | 18.4 | 7.1 | 11.3 | ||
| 2003 | 109.198 | 1 923 | 790 | 1 133 | 17.6 | 7.2 | 10.4 | 2.1 | |
| 2004 | 109.286 | 1 804 | 812 | 992 | 16.5 | 7.4 | 9.1 | 2.0 | |
| 2005 | 109.374 | 1 779 | 813 | 966 | 16.3 | 7.4 | 8.9 | 1.9 | 16.3 |
| 2006 | 109.462 | 1 796 | 777 | 1 019 | 16.4 | 7.2 | 9.2 | 2.1 | 27.8 |
| 2007 | 109.551 | 1 822 | 779 | 1 043 | 16.6 | 7.1 | 9.5 | 2.0 | 18.7 |
| 2008 | 109.639 | 1 901 | 848 | 1 053 | 17.3 | 7.7 | 9.6 | 2.1 | 19.4 |
| 2009 | 109.727 | 1 905 | 777 | 1 128 | 17.4 | 7.1 | 10.3 | 2.235 | 18.3 |
| 2010 | 109.814 | 1 784 | 827 | 957 | 16.2 | 7.5 | 8.7 | 2.253 | 21.3 |
| 2011 | 109.903 | 1 725 | 882 | 843 | 15.7 | 8.0 | 7.7 | 1.892 | 22.0 |
| 2012 | 109.991 | 1 840 | 858 | 982 | 16.7 | 7.8 | 8.9 | 2.213 | 13.6 |
| 2013 | 110.079 | 1 738 | 926 | 812 | 15.8 | 8.4 | 7.4 | 2.090 | 18.4 |
| 2014 | 110.166 | 1 841 | 1 006 | 835 | 16.7 | 9.1 | 7.6 | 2.211 | 15.8 |
| 2015 | 110.255 | 1 813 | 885 | 928 | 16.4 | 8.3 | 8.1 | 2.188 | 14.3 |
| 2016 | 110.343 | 1 729 | 930 | 799 | 15.8 | 8.0 | 7.8 | 2.102 | 14.5 |
| 2017 | 110.431 | 1 539 | 911 | 628 | 13.9 | 8.2 | 5.7 | 1.858 | 11.0 |
| 2018 | 110.520 | 1 524 | 965 | 559 | 13.8 | 8.7 | 5.1 | 1.848 | 14.4 |
| 2019 | 110.608 | 1 426 | 1 023 | 403 | 12.9 | 9.2 | 3.7 | 1.739 | 10.5 |
| 2020 | 110.696 | 1 320 | 1 046 | 274 | 11.9 | 9.4 | 2.5 | 1.598 | 15.9 |
| 2021 | 110.784 | 1 370 | 1 184 | 186 | 12.4 | 10.7 | 1.7 | 1.756 | 16.8 |
| 2022 | 110.872 | ||||||||
Structure of the population
| Age Group | Male | Female | Total | % |
|---|---|---|---|---|
| Total | 50 009 | 49 077 | 99 086 | 100 |
| 0-4 | 4 782 | 4 520 | 9 302 | 9.39 |
| 5-9 | 5 352 | 5 332 | 10 684 | 10.78 |
| 10-14 | 5 269 | 5 122 | 10 391 | 10.49 |
| 15-19 | 5 293 | 5 238 | 10 531 | 10.63 |
| 20-24 | 4 639 | 4 420 | 9 060 | 9.14 |
| 25-29 | 4 057 | 3 884 | 7 941 | 8.01 |
| 30-34 | 3 747 | 3 408 | 7 155 | 7.22 |
| 35-39 | 3 911 | 3 614 | 7 525 | 7.59 |
| 40-44 | 3 214 | 3 029 | 6 243 | 6.30 |
| 45-49 | 2 252 | 2 158 | 4 410 | 4.45 |
| 50-54 | 1 807 | 1 674 | 3 481 | 3.51 |
| 55-59 | 1 299 | 1 296 | 2 595 | 2.62 |
| 60-64 | 1 222 | 1 328 | 2 550 | 2.57 |
| 65-69 | 1 143 | 1 236 | 2 379 | 2.40 |
| 70-74 | 831 | 989 | 1 819 | 1.84 |
| 75-79 | 591 | 821 | 1 412 | 1.43 |
| 80-84 | 359 | 520 | 879 | 0.89 |
| 85+ | 241 | 488 | 729 | 0.74 |
| Age group | Male | Female | Total | Percent |
| 0-14 | 15 403 | 14 974 | 30 377 | 30.66 |
| 15-64 | 31 441 | 30 049 | 61 490 | 62.06 |
| 65+ | 3 165 | 4 054 | 7 219 | 7.29 |
| Age Group | Male | Female | Total | % |
|---|---|---|---|---|
| Total | 56 826 | 53 958 | 110 784 | 100 |
| 0–4 | 4 413 | 4 357 | 8 770 | 7.92 |
| 5–9 | 4 407 | 4 237 | 8 644 | 7.80 |
| 10–14 | 5 158 | 4 746 | 9 904 | 8.94 |
| 15–19 | 5 169 | 4 888 | 10 057 | 9.08 |
| 20–24 | 4 454 | 4 278 | 8 732 | 7.88 |
| 25–29 | 4 325 | 4 113 | 8 438 | 7.62 |
| 30–34 | 3 976 | 4 000 | 7 976 | 7.20 |
| 35–39 | 3 927 | 3 736 | 7 663 | 6.92 |
| 40–44 | 3 859 | 3 403 | 7 262 | 6.56 |
| 45–49 | 3 950 | 3 627 | 7 576 | 6.84 |
| 50–54 | 3 515 | 3 131 | 6 645 | 6.00 |
| 55–59 | 2 703 | 2 403 | 5 106 | 4.61 |
| 60–64 | 2 015 | 1 862 | 3 877 | 3.50 |
| 65-69 | 1 490 | 1 392 | 2 883 | 2.60 |
| 70-74 | 1 311 | 1 262 | 2 573 | 2.32 |
| 75-79 | 985 | 1 021 | 2 006 | 1.81 |
| 80-84 | 678 | 785 | 1 463 | 1.32 |
| 85+ | 491 | 716 | 1 207 | 1.09 |
| Age group | Male | Female | Total | Percent |
| 0–14 | 13 978 | 13 340 | 27 318 | 24.66 |
| 15–64 | 37 893 | 35 442 | 73 335 | 66.20 |
| 65+ | 4 955 | 5 176 | 10 131 | 9.14 |
Ethnic groups
Saint Vincents's population is predominantly African (77,764 in 2012; 71.2% of the total population) or of mixed African-European descent (25,111; 27.6%). 1.1% of the population is East Indian (1,199 residents in 2001) and 1.5% white (753 Portuguese and 889 other white).[1]
Saint Vincent & the Grenadines also has a small indigenous (Amerindian/Carib) population. During the past decades the indigenous population changed from 3,347 at the 1991 census (3.1% of the population) to 3,898 at the 2001 census (3.6% of the population) to 3,280 at the 2012 census (3.0% of the population).[9]
Black Caribs are originally from the island of Saint Vincent, formed in the 18th century by the mixture between Kalinago and enslaved Africans who escaped. A part of their community (now known as Garifuna) was expelled from St. Vincent in 1797 and exported to the island of Roatán, Honduras, from where they migrated to the Caribbean coast of the mainland of Central America and spread as far as Belize and Nicaragua.[10] While the Garifuna have retained their Kalinago language,[11] the Black Caribs of Saint Vincent and the Grenadines speak Creole English.[12]
The remaining 0.8% of the population includes Chinese and people from the Middle East.
Language
While the official language is English most Vincentians speak Vincentian Creole, an English-based creole, as their mother tongue.[14] English is used in education, government, religion, and other formal domains, while Creole (or "dialect" as it is referred to locally) is used in informal situations such as in the home and among friends.[15]
Religion
Protestant 75% (Anglican 47%, Methodist 28%), Roman Catholic 13%, other (includes Hindu, Seventh-Day Adventist, other Protestant) 12%.[13]
According to the 2001 census, 81.5% of the population of Saint Vincent and the Grenadines is considered Christian, 6.7% has another religion and 8.8% has no religion or did not state a religion (1.5%).[16]
According to the 2012 census, 82.3% of the population identifies as Christian (mainly Pentecostal, Anglican or Seventh-day Adventists); 7.5% have no religion, and there are groups of Rastafarians, Muslims, Hindus, Jews and Baha’is.[17]
Between 1991 and 2001 the number of Anglicans, Brethren, Methodists and Roman Catholics decreased, while the number of Pentecostals, Evangelicals and Seventh-day Adventists increased.
References
- 1 2 3 4 "Saint Vincent and the Grenadines Population and Housing Census Report 2012" (PDF). Statistical Office, Government of Saint Vincent and the Grenadines. 2012. Archived from the original (PDF) on 22 April 2023.
- ↑ "A few highlights from the last census". iWitness News, St. Vincent and the Grenadines. 12 May 2023. Archived from the original on 23 May 2023.
- ↑ "World Population Prospects 2022". population.un.org. United Nations Department of Economic and Social Affairs, Population Division. Retrieved July 17, 2022.
- ↑ "World Population Prospects 2022: Demographic indicators by region, subregion and country, annually for 1950-2100" (XSLX). population.un.org ("Total Population, as of 1 July (thousands)"). United Nations Department of Economic and Social Affairs, Population Division. Retrieved July 17, 2022.
- ↑ "United Nations : Demographic Yearbooks". Unstats.un.org. Retrieved 30 August 2017.
- ↑ "DEMOGRAPHIC PROFILE: ST VINCENT AND THE GRENADINES" (PDF). Caricomstats.org. Retrieved 30 August 2017.
- ↑ "United Nations Statistics Division - Demographic and Social Statistics". unstats.un.org. Retrieved 30 August 2017.
- ↑ "UNSD — Demographic and Social Statistics". unstats.un.org. Retrieved 2023-05-10.
- ↑ "Total Household Population by Ethnic Group and Sex, 1991 to 2012". Statistical Office, Government of Saint Vincent and the Grenadines. Retrieved 1 March 2021.
- ↑ Garifuna reach: Historia de los garífunas. Posted by Itarala.
- ↑ "Garifuna". Ethnologue.com. Retrieved 30 August 2017.
- ↑ "Saint Vincent and the Grenadines". Ethnologue.com. Retrieved 30 August 2017.
- 1 2 3 "Central America and Caribbean :: SAINT VINCENT AND THE GRENADINES". CIA The World Factbook. 2 May 2023.
- ↑ "Vincentian Creole English". Ethnologue.com. Retrieved 30 August 2017.
- ↑ "The Classification of the English-Lexifier Creole Languages Spoken in Grenada, Guyana, St. Vincent, and Tobago Using a Comparison of the Markers of Some Key Grammatical Features". Sil.org. Retrieved 30 August 2017.
- ↑ "Saint Vincent and the Grenadines : Population and Housing Census 2001". Stats.gov.vc. Archived from the original on 11 September 2018. Retrieved 30 August 2017.
- ↑ US State Department, 2022 report on Saint Vincent and the Grenadines