East Sussex County Council in England is elected every four years.
Council elections
- 1973 East Sussex County Council election
- 1977 East Sussex County Council election
- 1981 East Sussex County Council election
- 1985 East Sussex County Council election
- 1989 East Sussex County Council election
- 1993 East Sussex County Council election
- 1997 East Sussex County Council election
- 2001 East Sussex County Council election
- 2005 East Sussex County Council election (boundary changes increased the number of seats by 5)[1]
- 2009 East Sussex County Council election
- 2013 East Sussex County Council election
- 2017 East Sussex County Council election
- 2021 East Sussex County Council election
County result maps
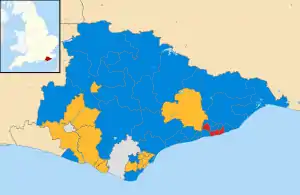 2009 results map
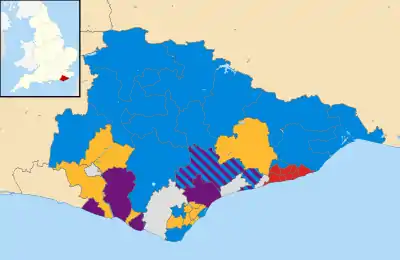 2013 results map
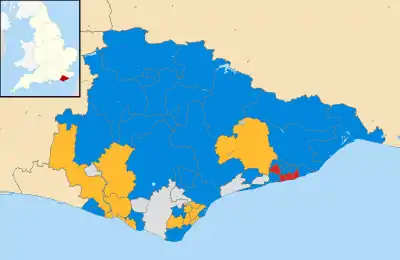 2017 results map
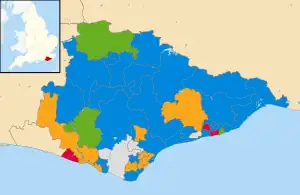 2021 results map
By-election results
1989-1993
| Party | Candidate | Votes | % | ±% | |
|---|---|---|---|---|---|
| Conservative | Simon Radford-Kirby | 990 | 49.0 | ||
| Labour | John Stevens | 923 | 45.7 | ||
| Liberal Democrats | Martin Jones | 108 | 5.3 | ||
| Majority | 67 | 3.3 | |||
| Turnout | 2,021 | ||||
| Conservative gain from Labour | Swing | ||||
1993-1997
| Party | Candidate | Votes | % | ±% | |
|---|---|---|---|---|---|
| Liberal Democrats | 1,198 | 58.9 | |||
| Conservative | 530 | 26.1 | |||
| Labour | 305 | 15.0 | |||
| Majority | 668 | 32.8 | |||
| Turnout | 2,033 | 24.4 | |||
| Liberal Democrats hold | Swing | ||||
1997-2001
| Party | Candidate | Votes | % | ±% | |
|---|---|---|---|---|---|
| Labour | 798 | 53.4 | +15.4 | ||
| Conservative | 358 | 24.0 | -4.3 | ||
| Liberal Democrats | 337 | 22.6 | -11.1 | ||
| Majority | 440 | 29.4 | |||
| Turnout | 1,493 | 15.5 | |||
| Labour hold | Swing | ||||
| Party | Candidate | Votes | % | ±% | |
|---|---|---|---|---|---|
| Labour | 885 | 59.5 | +15.7 | ||
| Liberal Democrats | 343 | 23.1 | -6.9 | ||
| Conservative | 259 | 17.4 | -5.5 | ||
| Majority | 542 | 36.4 | |||
| Turnout | 1,487 | ||||
| Labour hold | Swing | ||||
| Party | Candidate | Votes | % | ±% | |
|---|---|---|---|---|---|
| Liberal Democrats | 1,786 | 54.8 | +12.5 | ||
| Conservative | 1,476 | 45.2 | +2.1 | ||
| Majority | 310 | 9.6 | |||
| Turnout | 3,262 | ||||
| Liberal Democrats gain from Conservative | Swing | ||||
| Party | Candidate | Votes | % | ±% | |
|---|---|---|---|---|---|
| Conservative | 1,027 | 43.9 | +5.4 | ||
| Labour | 773 | 33.0 | +1.2 | ||
| Liberal Democrats | 542 | 23.1 | -6.5 | ||
| Majority | 254 | 10.9 | |||
| Turnout | 2,342 | 22.7 | |||
| Conservative hold | Swing | ||||
2001-2005
| Party | Candidate | Votes | % | ±% | |
|---|---|---|---|---|---|
| Conservative | Martin Kenward | 1,117 | 61.6 | +19.6 | |
| Liberal Democrats | 695 | 38.4 | +14.7 | ||
| Majority | 422 | 23.2 | |||
| Turnout | 1,812 | 23.7 | |||
| Conservative hold | Swing | ||||
2005-2009
| Party | Candidate | Votes | % | ±% | |
|---|---|---|---|---|---|
| Conservative | Simon Radford-Kirby | 1,293 | 70.0 | +20.1 | |
| Liberal Democrats | Cynthia Dewick | 406 | 22.0 | -10.6 | |
| Labour | Robert Walker | 147 | 8.0 | -9.5 | |
| Majority | 887 | 48.0 | |||
| Turnout | 1,846 | 25.7 | |||
| Conservative hold | Swing | +15.4% | |||
| Party | Candidate | Votes | % | ±% | |
|---|---|---|---|---|---|
| Conservative | Michael Ensor | 2,825 | 62.3 | +23.1 | |
| Liberal Democrats | John Kemp | 1,191 | 26.3 | -4.3 | |
| Labour | Timothy Macpherson | 518 | 11.4 | -18.8 | |
| Majority | 1,634 | 36.0 | |||
| Turnout | 4,534 | 25.0 | |||
| Conservative hold | Swing | ||||
References
- ↑ "Local election results: East Sussex". BBC News Online. Retrieved 31 August 2009.
- ↑ "Pevensey & Westham Electoral Division" (PDF). Wealden District Council. Archived from the original (PDF) on 27 October 2007. Retrieved 31 August 2009.
- ↑ "Declaration of Result of Poll 12 June 2008". Rother District Council. Retrieved 31 August 2009.
External links
| East Sussex County Council | |
|---|---|
| Brighton and Hove City Council | |
| Eastbourne Borough Council | |
| Hastings Borough Council | |
| Lewes District Council | |
| Rother District Council | |
| Wealden District Council | |
| Brighton Borough Council | |
| Hove Borough Council |
|
| |
This article is issued from Wikipedia. The text is licensed under Creative Commons - Attribution - Sharealike. Additional terms may apply for the media files.